
جميع الكتب

مهني

1 Markets I: The Ecosystem and Exchange-Traded Marketsالأسواق عبر الإنترنت 2 Markets II: Rates, FX and Creditالأسواق عبر الإنترنت 3 Markets III: Commodities, Energy and Cryptoالأسواق عبر الإنترنت 4 Quantitative Methodsالأساليب عبر الإنترنت 5 Derivatives and Volatilityالمشتقات عبر الإنترنت 6 Rates, Credit, XVA and Riskالفائدة والائتمان والمخاطر عبر الإنترنت 7 Research Craft: Predictors, Backtests, Measurement, Portfoliosالبحث عبر الإنترنت 8 Strategies I: Equities and Futuresالاستراتيجيات عبر الإنترنت 9 Strategies II: Volatility, Relative Value, Macro and the Bank Desksالاستراتيجيات عبر الإنترنت 10 Microstructure and Executionالتنفيذ عبر الإنترنت 11 Market Making and High-Frequency Tradingصناعة السوق عبر الإنترنت 12 Machine Learning for Marketsتعلم الآلة عبر الإنترنت 13 Low-Latency Softwareالتكنولوجيا عبر الإنترنت 14 Networks, Hardware and Trading Infrastructureالتكنولوجيا عبر الإنترنت 15 Research, Data and Risk Platformsالتكنولوجيا عبر الإنترنت 16 The Desk and the Firmالشركة عبر الإنترنت 17 The Industry: Firms, Roles and Careersالمسارات المهنية عبر الإنترنت 18 The Interview Bookالمسارات المهنية عبر الإنترنت
التطبيقات حول المدرب تسجيل الدخول ابدأ القراءة

Quantitative Finance · المسرد

ما معنى Front-to-back flow؟

Definition 1.1 Research, Data and Risk Platforms · الفصل 1 — The Platform Map

The front-to-back flow of a trading firm is the path that a trade and the data about it take through the firm’s systems: market and reference data; the decision and the order; the execution; the position and its P&L; the risk it adds; its booking, confirmation, settlement and reconciliation; and the controls and reports that close the day.
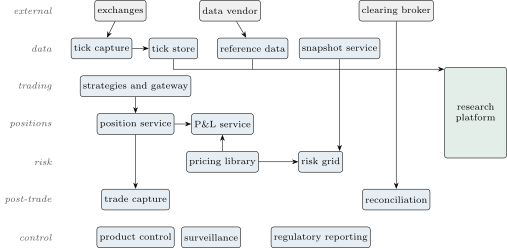
The miniature firm’s systems by layer, from the venues at the top to the controls at the bottom; the research platform reads the tick store and the reference data beside the trading path. Arrows show the main direction of the day’s data; the full set of flows is the map’s data (pl_platmap), not the drawing.
Figure 1.1. The miniature firm’s systems by layer, from the venues at the top to the controls at the bottom; the research platform reads the tick store and the reference data beside the trading path. Arrows show the main direction of the day’s data; the full set of flows is the map’s data (pl_platmap), not the drawing.

أمثلة

Example 1.2 (The miniature firm in numbers)

The map of the miniature firm (pl_platmap) has 18 systems, 22 datasets and 15 end-of-day jobs. Seven datasets arrive from outside: the day’s fills, the day’s market-data capture, the official closing prices, a market-data snapshot of curves and volatilities, the vendor’s reference-data and corporate-action files, and the clearing broker’s statement. Every other dataset is produced by exactly one job from others.

اقرأ في الفصل →