جميع الكتب

مهني

1 Markets I: The Ecosystem and Exchange-Traded Marketsالأسواق عبر الإنترنت 2 Markets II: Rates, FX and Creditالأسواق عبر الإنترنت 3 Markets III: Commodities, Energy and Cryptoالأسواق عبر الإنترنت 4 Quantitative Methodsالأساليب عبر الإنترنت 5 Derivatives and Volatilityالمشتقات عبر الإنترنت 6 Rates, Credit, XVA and Riskالفائدة والائتمان والمخاطر عبر الإنترنت 7 Research Craft: Predictors, Backtests, Measurement, Portfoliosالبحث عبر الإنترنت 8 Strategies I: Equities and Futuresالاستراتيجيات عبر الإنترنت 9 Strategies II: Volatility, Relative Value, Macro and the Bank Desksالاستراتيجيات عبر الإنترنت 10 Microstructure and Executionالتنفيذ عبر الإنترنت 11 Market Making and High-Frequency Tradingصناعة السوق عبر الإنترنت 12 Machine Learning for Marketsتعلم الآلة عبر الإنترنت 13 Low-Latency Softwareالتكنولوجيا عبر الإنترنت 14 Networks, Hardware and Trading Infrastructureالتكنولوجيا عبر الإنترنت 15 Research, Data and Risk Platformsالتكنولوجيا عبر الإنترنت 16 The Desk and the Firmالشركة عبر الإنترنت 17 The Industry: Firms, Roles and Careersالمسارات المهنية عبر الإنترنت 18 The Interview Bookالمسارات المهنية عبر الإنترنت
التطبيقات حول المدرب تسجيل الدخول ابدأ القراءة

Quantitative Finance · المسرد

ما معنى Rebalancing-flow estimate؟

Definition 15.2 Strategies II: Volatility, Relative Value, Macro and the Bank Desks · الفصل 15 — FX Flow Strategies

A rebalancing-flow estimate is a forecast of the currency that hedged international investors must buy or sell at a rebalancing date, from the month’s asset returns, estimates of their holdings, and their hedge ratios.
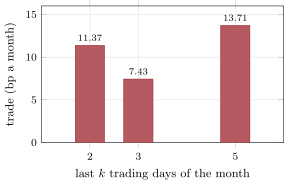
A month-end hedge-flow trade in public data: sell a six-currency dollar index over the month’s last k days when the S&P 500 has risen since the month began, buy it when the S&P has fallen; mean return a month, January 1999 to September 2026 (332 months). From FRED’s H.10 rates and Cboe’s S&P 500 history; derived statistics only. Data: s2_fetch_monthend.
Figure 15.1. A month-end hedge-flow trade in public data: sell a six-currency dollar index over the month’s last kk days when the S&P 500 has risen since the month began, buy it when the S&P has fallen; mean return a month, January 1999 to September 2026 (332 months). From FRED’s H.10 rates and Cboe’s S&P 500 history; derived statistics only. Data: s2_fetch_monthend.
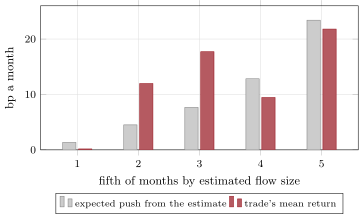
The synthetic month-end flow trade by fifth of the estimated flow’s size: the push the estimate implies and the trade’s mean return after costs, 360 months. Data: s2_fxflows.results.
Figure 15.2. The synthetic month-end flow trade by fifth of the estimated flow’s size: the push the estimate implies and the trade’s mean return after costs, 360 months. Data: s2_fxflows.results.
اقرأ في الفصل →