Physics · Glossary

What is Energy diagram, turning points?

Also known as: energy diagram · turning point

Definition 29.12 High School Physics · Chapter 29 — Work and Mechanical Energy

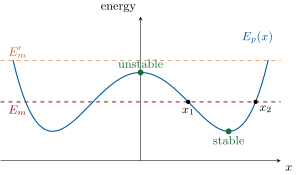
For a motion along one axis xx with conserved EmE_m, the energy diagram plots the curve Ep(x)E_p(x) and the horizontal line EmE_m. Since Ek=EmEp0E_k = E_m - E_p \geq 0, the motion is confined to where the curve lies below the line; the gap between them is EkE_k, read directly. At a turning point, where curve meets line, v=0v = 0 and the motion reverses.

An energy diagram, read without solving anything: with energy E_m the body oscillates between x_1 and x_2, fastest where the gap is largest; with E_m' it crawls over the hill and escapes.
An energy diagram, read without solving anything: with energy EmE_m the body oscillates between x1x_1 and x2x_2, fastest where the gap is largest; with EmE_m' it crawls over the hill and escapes.
Read in context →