
جميع الكتب

مهني

1 Markets I: The Ecosystem and Exchange-Traded Marketsالأسواق عبر الإنترنت 2 Markets II: Rates, FX and Creditالأسواق عبر الإنترنت 3 Markets III: Commodities, Energy and Cryptoالأسواق عبر الإنترنت 4 Quantitative Methodsالأساليب عبر الإنترنت 5 Derivatives and Volatilityالمشتقات عبر الإنترنت 6 Rates, Credit, XVA and Riskالفائدة والائتمان والمخاطر عبر الإنترنت 7 Research Craft: Predictors, Backtests, Measurement, Portfoliosالبحث عبر الإنترنت 8 Strategies I: Equities and Futuresالاستراتيجيات عبر الإنترنت 9 Strategies II: Volatility, Relative Value, Macro and the Bank Desksالاستراتيجيات عبر الإنترنت 10 Microstructure and Executionالتنفيذ عبر الإنترنت 11 Market Making and High-Frequency Tradingصناعة السوق عبر الإنترنت 12 Machine Learning for Marketsتعلم الآلة عبر الإنترنت 13 Low-Latency Softwareالتكنولوجيا عبر الإنترنت 14 Networks, Hardware and Trading Infrastructureالتكنولوجيا عبر الإنترنت 15 Research, Data and Risk Platformsالتكنولوجيا عبر الإنترنت 16 The Desk and the Firmالشركة عبر الإنترنت 17 The Industry: Firms, Roles and Careersالمسارات المهنية عبر الإنترنت 18 The Interview Bookالمسارات المهنية عبر الإنترنت
التطبيقات حول المدرب تسجيل الدخول ابدأ القراءة

Quantitative Finance · المسرد

ما معنى Bachelier model, normal volatility؟

يُعرف أيضًا باسم: Bachelier model · normal volatility

Definition 13.4 Markets II: Rates, FX and Credit · الفصل 13 — The Rates Options Market

The Bachelier model, published by Louis Bachelier in 1900, assumes that the forward rate follows dFt=σN dWtdF_t = \sigma_N\,dW_t: it moves by normally distributed amounts, independent of its level, and can go negative. Its parameter σN\sigma_N, in basis points a year, is the normal volatility; the implied normal volatility of an option is the σN\sigma_N at which the model reproduces its price.
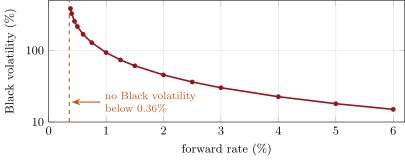
The Black volatility that gives the same one-year at-the-money price as a normal volatility of 90 basis points, by forward rate, on a logarithmic scale. The same option looks calm at 5% and wild at 0.5%; below the dashed line no Black volatility exists. Data: the chapter’s tutorial.
Figure 13.3. The Black volatility that gives the same one-year at-the-money price as a normal volatility of 90 basis points, by forward rate, on a logarithmic scale. The same option looks calm at 5% and wild at 0.5%; below the dashed line no Black volatility exists. Data: the chapter’s tutorial.

أمثلة

Example 13.6 (A straddle)

On a flat 4% curve the 1y×\times10y forward annuity is 7.80. At 95 basis points of normal volatility, a straddle on USD 100 million costs 7.80×0.0095×2/π=5.91%7.80 \times 0.0095 \times \sqrt{2/\pi} = 5.91\% of notional, USD 5.91 million. Divided by the annuity it is 75.8 basis points: the ten-year rate must end more than about 76 basis points away from 4% for the straddle held to expiry to pay for itself.

Example 13.2 (A cap and a zero-cost collar)

On a flat 4% curve, a five-year cap at 4.5% on USD 100 million of an annual rate, with the first period already fixed, has four caplets fixing in one to four years. At a normal volatility of 100 basis points a year they are worth USD 182 874, 310 339, 401 400 and 470 709: USD 1.37 million in all, 137 basis points of notional. A floor at 3.5% is worth exactly the same, since the forward sits halfway between the strikes and the normal model is symmetric: the borrower who buys the cap and sells the floor pays nothing and keeps its rate between 3.5% and 4.5%.

اقرأ في الفصل →