सभी किताबें

पेशेवर

ऐप्स परिचय Coach लॉग इन पढ़ना शुरू करें

Quantitative Finance · शब्दावली

Base correlation क्या है?

Definition 24.6 Markets II: Rates, FX and Credit · अध्याय 24 — Credit Indices and Tranches

The base correlation for a detachment point dd is the correlation ρ\rho at which the one-factor model prices the tranche from 0 to dd at its market value; a tranche from aa to dd is then valued as the difference of the base tranches [0,d][0,d] and [0,a][0,a], each at its own correlation.

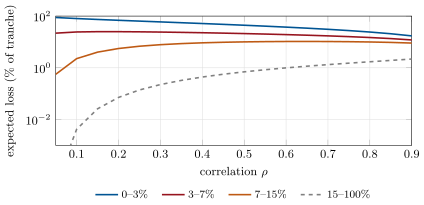
Five-year expected loss of each tranche, in per cent of its notional and on a log scale, against the correlation of the one-factor Gaussian model (default probability 5.95%, recovery 40%). The equity’s expected loss falls with correlation and the super senior’s rises; the mezzanine’s rises and then falls, and so, at high correlations, does the 7–15% tranche’s. Illustrative; data: the chapter’s tutorial.
Figure 24.4. Five-year expected loss of each tranche, in per cent of its notional and on a log scale, against the correlation of the one-factor Gaussian model (default probability 5.95%, recovery 40%). The equity’s expected loss falls with correlation and the super senior’s rises; the mezzanine’s rises and then falls, and so, at high correlations, does the 7–15% tranche’s. Illustrative; data: the chapter’s tutorial.
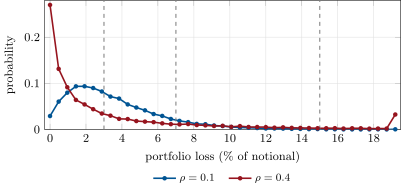
Simulated distribution of the five-year loss of the 125-name portfolio, one point per number of defaults (0.48% each), for correlations of 0.1 and 0.4; the last point collects 40 defaults or more. Dashed lines mark the 3, 7 and 15% attachment points. Higher correlation puts more weight on no defaults and on many. Illustrative; data: the chapter’s tutorial, 20 000 seeded draws.
Figure 24.5. Simulated distribution of the five-year loss of the 125-name portfolio, one point per number of defaults (0.48% each), for correlations of 0.1 and 0.4; the last point collects 40 defaults or more. Dashed lines mark the 3, 7 and 15% attachment points. Higher correlation puts more weight on no defaults and on many. Illustrative; data: the chapter’s tutorial, 20 000 seeded draws.

उदाहरण

Example 24.7 (Tranche losses)

For the stylised index, the five-year default probability implied by the intrinsic spread is 5.95%, and the portfolio’s expected loss 3.57%. With ρ=0.3\rho = 0.3 the expected losses are 59.6% of the equity tranche, 24.1% of the mezzanine, 7.83% of the senior and 0.22% of the super senior; weighted by their widths, 3, 4, 8 and 85%, they add up to 3.57%. The equity’s expected loss is 64.0% at ρ=0.25\rho = 0.25, and inverting the model at that value returns a base correlation of 25%. The mezzanine’s is 24.3% at ρ=0.10\rho = 0.10, 25.0% at 0.20 and 21.9% at 0.45: it is 24.3% again at 0.28.

अध्याय में पढ़ें →