 Coach
CoachA calibration curve plots the mean realised return of names grouped by forecast (in bins) against the mean forecast. Isotonic regression fits the best non-decreasing function of the score to realised returns by least squares, by pooling adjacent groups that violate the order (Ayer, Brunk, Ewing, Reid and Silverman, 1955).
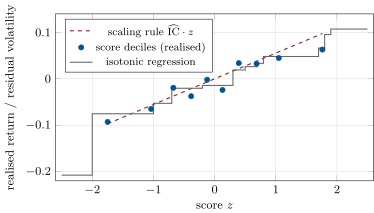
rs_forecast on firm.synthmkt.