
جميع الكتب

مهني

1 Markets I: The Ecosystem and Exchange-Traded Marketsالأسواق عبر الإنترنت 2 Markets II: Rates, FX and Creditالأسواق عبر الإنترنت 3 Markets III: Commodities, Energy and Cryptoالأسواق عبر الإنترنت 4 Quantitative Methodsالأساليب عبر الإنترنت 5 Derivatives and Volatilityالمشتقات عبر الإنترنت 6 Rates, Credit, XVA and Riskالفائدة والائتمان والمخاطر عبر الإنترنت 7 Research Craft: Predictors, Backtests, Measurement, Portfoliosالبحث عبر الإنترنت 8 Strategies I: Equities and Futuresالاستراتيجيات عبر الإنترنت 9 Strategies II: Volatility, Relative Value, Macro and the Bank Desksالاستراتيجيات عبر الإنترنت 10 Microstructure and Executionالتنفيذ عبر الإنترنت 11 Market Making and High-Frequency Tradingصناعة السوق عبر الإنترنت 12 Machine Learning for Marketsتعلم الآلة عبر الإنترنت 13 Low-Latency Softwareالتكنولوجيا عبر الإنترنت 14 Networks, Hardware and Trading Infrastructureالتكنولوجيا عبر الإنترنت 15 Research, Data and Risk Platformsالتكنولوجيا عبر الإنترنت 16 The Desk and the Firmالشركة عبر الإنترنت 17 The Industry: Firms, Roles and Careersالمسارات المهنية عبر الإنترنت 18 The Interview Bookالمسارات المهنية عبر الإنترنت
التطبيقات حول المدرب تسجيل الدخول ابدأ القراءة

Quantitative Finance · المسرد

ما معنى Call auction and uncrossing price؟

يُعرف أيضًا باسم: call auction · uncrossing price

Definition 13.1 Markets I: The Ecosystem and Exchange-Traded Markets · الفصل 13 — Auctions

In a call auction orders are collected for a period without being executed; at the end of it a single uncrossing price is computed, and every order that can trade at that price does, at that price. Opening and closing auctions, volatility interruptions and initial public offerings are call auctions; so, in miniature, are the periodic auctions of Definition 11.9.
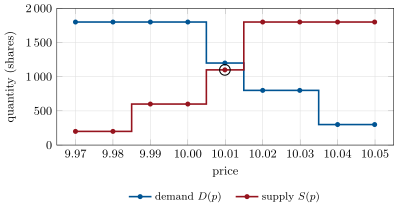
Demand and supply of . The curves are step functions of the price; the auction trades the largest quantity on which they can agree, 1 100 shares at 10.01 (circled: the lower of the two curves is highest there). Data: the chapter’s example book.
Figure 13.1. Demand and supply of Example 13.3. The curves are step functions of the price; the auction trades the largest quantity on which they can agree, 1 100 shares at 10.01 (circled: the lower of the two curves is highest there). Data: the chapter’s example book.

أمثلة

Example 13.3 (Eight orders)

Buyers: 300 at market; 500 at 10.03; 400 at 10.01; 600 at 10.00. Sellers: 200 at market; 400 at 9.99; 500 at 10.01; 700 at 10.02. The reference price is 10.00.

PriceD(p)D(p)S(p)S(p)ExecutableSurplus
9.991 800600600+1 200+1\,200
10.001 800600600+1 200+1\,200
10.011 2001 1001 100+100+100
10.028001 800800−1 000-1\,000
10.038001 800800−1 000-1\,000

Rule 1 alone selects 10.01: 1 100 shares trade. On the buy side the market order (300) and the order at 10.03 (500) are filled in full and the order at 10.01 receives 300 of its 400; on the sell side everything up to 10.01 is filled. A buy surplus of 100 shares remains at 10.01, and that is what the exchange publishes as the closing imbalance.

اقرأ في الفصل →