جميع الكتب

مهني

1 Markets I: The Ecosystem and Exchange-Traded Marketsالأسواق عبر الإنترنت 2 Markets II: Rates, FX and Creditالأسواق عبر الإنترنت 3 Markets III: Commodities, Energy and Cryptoالأسواق عبر الإنترنت 4 Quantitative Methodsالأساليب عبر الإنترنت 5 Derivatives and Volatilityالمشتقات عبر الإنترنت 6 Rates, Credit, XVA and Riskالفائدة والائتمان والمخاطر عبر الإنترنت 7 Research Craft: Predictors, Backtests, Measurement, Portfoliosالبحث عبر الإنترنت 8 Strategies I: Equities and Futuresالاستراتيجيات عبر الإنترنت 9 Strategies II: Volatility, Relative Value, Macro and the Bank Desksالاستراتيجيات عبر الإنترنت 10 Microstructure and Executionالتنفيذ عبر الإنترنت 11 Market Making and High-Frequency Tradingصناعة السوق عبر الإنترنت 12 Machine Learning for Marketsتعلم الآلة عبر الإنترنت 13 Low-Latency Softwareالتكنولوجيا عبر الإنترنت 14 Networks, Hardware and Trading Infrastructureالتكنولوجيا عبر الإنترنت 15 Research, Data and Risk Platformsالتكنولوجيا عبر الإنترنت 16 The Desk and the Firmالشركة عبر الإنترنت 17 The Industry: Firms, Roles and Careersالمسارات المهنية عبر الإنترنت 18 The Interview Bookالمسارات المهنية عبر الإنترنت
التطبيقات حول المدرب تسجيل الدخول ابدأ القراءة

Quantitative Finance · المسرد

ما معنى Capture decay؟

Definition 28.2 Market Making and High-Frequency Trading · الفصل 28 — P&L Analytics and the Strategy Lifecycle

Capture decay is the decline over time of the share of the spread a market-making strategy keeps, or of the share of the flow it trades, as competitors copy it, venues change or the flow it served goes elsewhere.
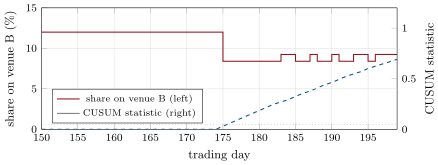
Detecting the competitor: the maker’s daily share of venue B’s volume and the one-sided CUSUM statistic of its shortfall from 12% (slack 0.5 point, threshold 0.05, dotted), days 150 to 199; the share falls on day 175 and the statistic crosses on day 176; the treated days after day 182 show the parameter’s 10% more share. Data: hf_attrib.cusum_path.
Figure 28.2. Detecting the competitor: the maker’s daily share of venue B’s volume and the one-sided CUSUM statistic of its shortfall from 12% (slack 0.5 point, threshold 0.05, dotted), days 150 to 199; the share falls on day 175 and the statistic crosses on day 176; the treated days after day 182 show the parameter’s 10% more share. Data: hf_attrib.cusum_path.
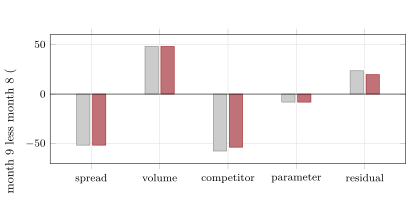
The month-on-month change in P&L attributed to the half-spread, market volume, the competitor on venue B and the parameter change, with the planted values and with the values estimated from the strategy’s data (the change point and the experiment); the residual is what neither explains. Data: hf_attrib.month9.
Figure 28.3. The month-on-month change in P&L attributed to the half-spread, market volume, the competitor on venue B and the parameter change, with the planted values and with the values estimated from the strategy’s data (the change point and the experiment); the residual is what neither explains. Data: hf_attrib.month9.
اقرأ في الفصل →