Market Making and High-Frequency Trading · Market making
28P&L Analytics and the Strategy Lifecycle
A market-making strategy earned less this month than last. The spread was narrower, volume was higher, a competitor arrived on one venue, and someone changed a parameter on the twelfth; the morning report has to say which of these did it. In this chapter’s simulated year, month 9 made $45 600 less than month 8: the narrower spread cost $51 500, higher volume gave back $48 000, the competitor took $57 400 and the parameter change $8 100, with $23 400 of noise the other way. Estimated from the strategy’s own data, without knowing what was planted, the competitor’s share comes out at $53 500 and the parameter’s at $8 100.
28.1 Daily attribution of a market-making book
A market maker’s daily P&L (One Quant Book 8, chapter 1) splits into what it earned from the spread, what it lost to informed flow, what its inventory made or lost, and its fees and rebates (One Quant Book 7, chapter 23, and chapter 1 here). For each venue and instrument, the expected part is a product:
with the market half-spread, the share of it the maker keeps (its capture ratio, net of fees and rebates) and the adverse selection per share, measured by mark-outs. The factors are observable separately: and from the market, from the maker’s fills, and from its fill prices and their mark-outs. A change in the product is a change in some factor, and the attribution’s job is to say which.
The chapter’s year (Figure 28.1): a maker on two venues, 10% of 20 million shares a day on one and 12% of 15 million on the other, keeping 80% of a one-cent half-spread and losing 0.35 cent a share to adverse selection. Planted in it: the half-spread narrows 10% and market volume rises 15% in month 9; a competitor arrives on venue B on day 175 and takes 30% of the maker’s share there and 15% of its capture ratio; a parameter change, from day 182, raises the maker’s share by 10% and its adverse selection by 0.10 cent a share on the days it is switched on.
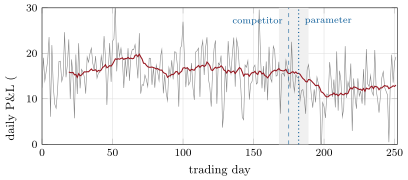
hf_attrib.daily.The month-on-month change is attributed by changing the factors one at a time, in a fixed order, from month 8’s values to month 9’s (Listing 28.2): the half-spread, then market volume, then the competitor, then the parameter. The spread and volume are measured from market data; the competitor’s effect and the parameter’s come from the next two sections. What is left is noise and the approximation of using monthly averages.
28.2 Parameter changes as experiments
Definition 28.1 (Parameter change control)
Parameter change control is the discipline of treating every change to a live strategy’s parameters as a recorded, reviewed and reversible experiment: who changed what, when and why, with the change applied to a randomised part of the strategy’s activity until its effect is measured.
A parameter changed on the twelfth for everything from then on is confounded with everything else that happened after the twelfth. Applied on randomised days instead (One Quant Book 7, chapter 21; Book 7’s firm.abtest assigns them by a hash), its effect is estimated by comparing treated and untreated days in the same weeks. Over the 70 days from day 182, 33 were treated: the parameter lowered daily P&L by $2 670 (standard error $1 070); adjusting for each day’s market volume (CUPED) gives $2 550 ($1 070). The factors are sharper than the P&L: the treated days’ share was exactly 10% higher and their adverse selection 0.10 cent a share higher, because both are measured on every fill. The parameter buys volume at a price in toxicity that exceeds its value; it should be rolled back.
28.3 Capture decay and competition
Definition 28.2 (Capture decay)
Capture decay is the decline over time of the share of the spread a market-making strategy keeps, or of the share of the flow it trades, as competitors copy it, venues change or the flow it served goes elsewhere.
A competitor shows up first in the maker’s share and capture ratio on the venue it joins. A one-sided CUSUM test (One Quant Book 7, chapter 13) on venue B’s daily share, against its target of 12% with a slack of half a percentage point, crosses its threshold on day 176, one day after the arrival (Figure 28.2); the same test on the capture ratio crosses the same day. Comparing the days before the change point with the untreated days after it estimates the competitor’s effect: 29.9% of the share and 14.9% of the capture ratio, against the planted 30% and 15%.
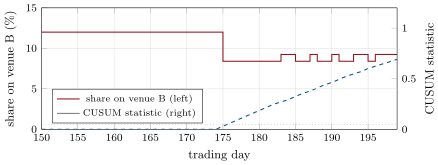
hf_attrib.cusum_path.With both estimates, month 9 attributes as in Figure 28.3: of the $45 600 fall, the estimated attribution gives the spread , volume , the competitor (planted: ) and the parameter (planted: ); the residual, $19 600, is the month’s noise in inventory, volume and spreads. The estimated competitor effect is smaller than the planted one because the change point comes a day late.
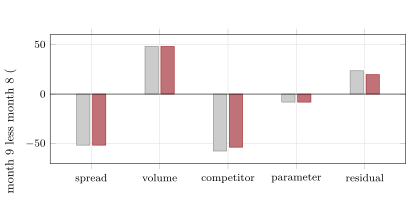
hf_attrib.month9.The order of attribution matters: the competitor’s effect evaluated at month 9’s narrower spread is smaller than at month 8’s. A fixed, documented order, or the average over orders (a Shapley attribution), is part of the report’s definition; so is reporting the residual rather than hiding it. Menkveld’s decomposition of one high-frequency market maker (chapter 1: € 1.55 a trade on the spread net of fees, € 0.68 lost on positions) is the same idea at the level of a firm’s whole book.
28.4 When to retire a strategy
Definition 28.3 (Strategy lifecycle)
The strategy lifecycle is the sequence a trading strategy goes through, from research, review and a staged launch, through monitored production and changes run as experiments, to reduction and retirement when its measured edge no longer covers its costs, each stage with its criteria written in advance.
A retirement rule is a kill criterion (One Quant Book 7, chapter 1) for a whole strategy: stop when the edge, measured over a window long enough to be reliable, falls below what the strategy costs to run (people, technology, capital). In the simulated year the maker earned $16 600 a day before month 8; after the competitor and with the parameter half on, $12 200. A rule that retires the strategy when its 60-day mean falls below a cost of $12 000 a day fires on day 239; at $13 000 a day, on day 221; at $10 000, never. The rule is a decision to make before the decay, not after it: the cost is known in advance, the window sets how fast the rule can act and how often it errs.
28.5 Tutorial: which of these did it
Goal. Attribute a month’s change in a market maker’s P&L to its causes, with the causes estimated from the strategy’s own data. End state: the four figures and the numbers of the text.
- The year with planted events (
firm.mmattrib.Year) and its daily attribution. - The competitor: CUSUM on venue B’s share and capture ratio, then the effect from before and after the change point.
The parameter: the randomised experiment (
firm.mmattrib.experimenton Book 7’sfirm.abtest).def experiment(y: Year, first: int, last: int) -> dict: sel = np.arange(y.days) sel = sel[(sel >= first) & (sel <= last)] t = y.treated[sel] tot = y.pnl[sel].sum(axis=1) mvx = y.mv[sel].sum(axis=1) d, se = ab.diff_means(tot, t) dc, sec, _ = ab.cuped(tot, mvx[:, None], t) share = y.share[sel] adv = y.adverse[sel] return {"effect": d, "se": se, "cuped": dc, "cuped_se": sec, "share_mult": float(share[t].mean(axis=0).mean() / share[~t].mean(axis=0).mean()), "adverse_add": float(adv[t].mean() - adv[~t].mean()), "n_treated": int(t.sum()), "n": len(sel)}Listing 28.1. Treated against untreated days: the effect on daily P&L, with CUPED, and on share and adverse selection. code/firm/mmattrib/firm_mmattrib.py The attribution, factor by factor.
    def total(half, mv, share, kappa, adverse):
        return n1 * float(np.sum(mv * share * (kappa * half - adverse) / 100.0))

    s0 = total(half0, mv0, share0, kappa0, adv0) * int(a.sum()) / n1
    s1 = total(half1, mv0, share0, kappa0, adv0)
    s2 = total(half1, mv1, share0, kappa0, adv0)
    share_c = share0.copy()
    kappa_c = kappa0.copy()
    share_c[1] *= 1 - cs * comp_frac
    kappa_c[1] *= 1 - ck * comp_frac
    s3 = total(half1, mv1, share_c, kappa_c, adv0)
    share_p = share_c * (1 + (ps - 1) * treat_frac)
    adv_p = adv0 + pa * treat_frac
    s4 = total(half1, mv1, share_p, kappa_c, adv_p)
    realised = float(y.pnl[b].sum() - y.pnl[a].sum() * n1 / int(a.sum()))
    parts = {"spread": s1 - s0, "volume": s2 - s1, "competition": s3 - s2, "parameter": s4 - s3}
    return {**parts, "explained": s4 - s0, "realised": realised, "residual": realised - (s4 - s0)}
Listing 28.2. Change the half-spread, then volume, then the competitor, then the parameter; what is left is the residual. code/firm/mmattrib/firm_mmattrib.py
What to change next. Attribute with a Shapley average over orders; add a third venue where the competitor also arrives later; apply the experiment to half the instruments instead of half the days.
28.6 Build: the attribution engine
Purpose. Attribute a market maker’s P&L to its factors daily and month on month, detect changes in capture, run parameter changes as experiments, and apply a retirement rule.
Interface. Year(seed) and its planted-event parameters, attribution(year), cusum_down(x, target, k, h), experiment(year, first, last), month_change(year, m0, m1, est), retire_day(pnl, window, floor). Built on Book 7’s firm.abtest.
Rules. Dollars and cents per share; a fixed order of attribution; the residual reported.
Acceptance tests. code/firm/mmattrib/tests/: the parts add to the total and the observed capture ratio equals the planted one; the competitor lowers venue B’s share and the experiment starts on its day; CUSUM fires the day after a step and never without one; the experiment recovers the planted share and adverse selection; without noise the attribution leaves under 5% unexplained; the retirement rule fires after a drop and not before.
Stretch. Shapley attribution; attribution by instrument and venue at once; sequential tests for the experiment.
Sources and further reading
- A. J. Menkveld, High frequency trading and the new market makers, Journal of Financial Markets 16(4), 2013, 712–740.
- One Quant Book 7, chapters 1, 13 and 21 (kill criteria, CUSUM tests, experiments).
28.7 Exercises
Exercise 28.1 ★
A venue trades 15 million shares a day; the maker’s share is 12%, it keeps 80% of a one-cent half-spread and loses 0.35 cent a share. What does it make a day there?
Solution
Solution of Exercise 28.1.
a day.
Exercise 28.2 ★
The competitor cuts the share to 8.4% and the capture ratio to 68%. What does the venue make now, at the same spread?
Solution
Solution of Exercise 28.2.
a day.
Exercise 28.3 ★
The parameter raises the share by 10% and adverse selection by 0.10 cent. Does it pay on the example venue before the competitor?
Solution
Solution of Exercise 28.3.
, less than $8 100: it buys 10% more volume at a margin 22% thinner.
Exercise 28.4 ★★
Why is a parameter changed for all days from the twelfth hard to evaluate?
Solution
Solution of Exercise 28.4.
Everything else that changed after the twelfth (spreads, volumes, a competitor) changes the P&L at the same time; before and after cannot separate them. Randomising the days (or instruments) that get the change separates it from everything else.
Exercise 28.5 ★★
Why does the order of attribution change the competitor’s share of the fall?
Solution
Solution of Exercise 28.5.
The competitor cuts a share of a margin; the margin is smaller once the spread has narrowed. Evaluated after the spread’s change, the competitor’s effect is smaller than if it were evaluated first.
Exercise 28.6 ★★
Why are the share and adverse selection better measures of the parameter’s effect than daily P&L?
Solution
Solution of Exercise 28.6.
They are measured on every fill, with far less noise than a day’s P&L, which includes inventory and market moves; their effect on P&L then follows from the product.
Exercise 28.7 ★★★
Coding. Run the attribution on seeds 2 and 3. How large is the residual, and how close are the estimated competitor and parameter effects to the planted ones?
Solution
Solution of Exercise 28.7.
Seed 2: residual $6 400 planted ($2 600 estimated); competitor estimated against ; parameter against . Seed 3: residual (); competitor against ; parameter against . The competitor is underestimated by about $4 000 each time, the one day the change point comes late.
Exercise 28.8 ★★★
Find the flaw. “P&L fell after we changed the parameter on the twelfth, so the parameter change caused it; revert it.”
Solution
Solution of Exercise 28.8.
In the simulated month 9 the spread narrowed and a competitor arrived in the same weeks: they cost six times more than the parameter. Before and after cannot say which did it; the experiment and the factor measurements can.
28.8 Problem: Which of These Did It
Problem 28.1
Weekend problem — which of these did it
A market maker’s morning report must explain why month 9 made less than month 8.
Part I — Attribution.
- Write the expected daily P&L as a product of factors and say where each is measured.
- Describe the simulated year and its planted events.
- Describe the sequential attribution.
- What does Menkveld’s decomposition show at the level of a firm?
Part II — Estimating the causes.
- Define parameter change control.
- Give the experiment’s estimates, with and without CUPED.
- Define capture decay and describe the CUSUM detection.
- Give the estimated competitor effect against the planted one.
Part III — The attribution.
- Give the planted and estimated attribution of month 9.
- Why is the estimated competitor effect smaller?
- What is the residual?
- Why must the order of attribution be fixed and documented?
Part IV — The verdict.
- State the named result: the attribution of the month-on-month P&L change to spread, volume, competition and the parameter change, against the planted truth.
- Should the parameter be kept?
- Define the strategy lifecycle.
- When does the retirement rule fire, and on what does it depend?
- What should the report show every morning?
- How would a Shapley attribution differ?
- What would the competitor do to a strategy that cannot randomise its changes?
- In one sentence: what does attribution make possible?
Solution
Solution of Problem 28.1.
- : market volume and half-spread from the market, share from fills, capture ratio from fill prices, adverse selection from mark-outs.
- Two venues; month 9’s narrower spread and higher volume; a competitor on venue B on day 175; a parameter change on randomised days from day 182.
- Change one factor at a time from month 8 to month 9 in a fixed order; the residual is what is left.
- One market maker earned € 1.55 a trade on the spread and lost € 0.68 on positions.
- See Definition 28.1.
- a day (s.e. $1 070); with CUPED ($1 070); share and adverse selection cent exactly.
- See Definition 28.2; a one-sided CUSUM on venue B’s share crosses on day 176.
- 29.9% of share and 14.9% of capture ratio, against 30% and 15%.
- Planted: spread , volume , competitor , parameter , residual . Estimated: the same except competitor and residual .
- The change point is a day late, so the competitor’s effect applies to one day fewer.
- Noise in inventory, volume and spreads, and the approximation of monthly averages.
- The attribution depends on it; a report must be comparable month to month.
- Of month 9’s $45 600 fall: spread , volume , competition estimated ( planted), parameter (both), residual about $20 000.
- No: it costs $2 670 a day.
- See Definition 28.3.
- Day 239 at a cost of $12 000 a day with a 60-day window; it depends on the cost and the window.
- The day’s P&L by factor, venue and instrument; change points; experiments running; the residual.
- It averages each factor’s contribution over all orders, removing the order’s arbitrariness.
- Its changes would be confounded with the competitor’s arrival.
- Knowing which cause to act on.
28.9 Interview questions
Interview question 28.1 ★ trader
Your strategy’s P&L halved this week. What do you look at first?
Solution
Solution of Interview question 28.1.
The factors: market volume and spreads, the share and capture ratio by venue, adverse selection by mark-out, inventory P&L, fees; then any change made to the strategy.
What the interviewer is looking for: decompose before explaining.
Interview question 28.2 ★★ researcher
How would you detect that a competitor has joined your venue from your own data?
Solution
Solution of Interview question 28.2.
A change point in the share and capture ratio on that venue alone, with market volume unchanged, and queue positions that start later.
What the interviewer is looking for: venue-specific change points.
Interview question 28.3 ★★ developer
Design the system that records every parameter change and its experiment assignment, and produces the attribution report by 7 a.m.
Solution
Solution of Interview question 28.3.
A change log with who, what, when, why and the experiment’s assignment; overnight jobs joining fills, mark-outs, market data and assignments; the report built from them, with the residual.
What the interviewer is looking for: audit trail and reproducible reports.
Interview question 28.4 ★★ risk
A trader wants to change a live parameter now, not as an experiment. What do you require?
Solution
Solution of Interview question 28.4.
A written reason, review, a way to revert, and randomisation or a limited scope so its effect can be measured; exceptions only for risk reduction.
What the interviewer is looking for: change control.
Interview question 28.5 ★★ researcher
How many days does an experiment need to detect a $2 000-a-day effect with a daily standard deviation of $4 500?
Solution
Solution of Interview question 28.5.
About days per arm, 159 in all.
What the interviewer is looking for: the sample-size formula.
Interview question 28.6 ★★★ researcher
Show that a sequential attribution of a product of two factors assigns the interaction term to whichever factor is changed second.
Solution
Solution of Interview question 28.6.
: changing first gives it and gets , the interaction; the reverse order gives it to .
What the interviewer is looking for: the interaction term.