جميع الكتب

مهني

1 Markets I: The Ecosystem and Exchange-Traded Marketsالأسواق عبر الإنترنت 2 Markets II: Rates, FX and Creditالأسواق عبر الإنترنت 3 Markets III: Commodities, Energy and Cryptoالأسواق عبر الإنترنت 4 Quantitative Methodsالأساليب عبر الإنترنت 5 Derivatives and Volatilityالمشتقات عبر الإنترنت 6 Rates, Credit, XVA and Riskالفائدة والائتمان والمخاطر عبر الإنترنت 7 Research Craft: Predictors, Backtests, Measurement, Portfoliosالبحث عبر الإنترنت 8 Strategies I: Equities and Futuresالاستراتيجيات عبر الإنترنت 9 Strategies II: Volatility, Relative Value, Macro and the Bank Desksالاستراتيجيات عبر الإنترنت 10 Microstructure and Executionالتنفيذ عبر الإنترنت 11 Market Making and High-Frequency Tradingصناعة السوق عبر الإنترنت 12 Machine Learning for Marketsتعلم الآلة عبر الإنترنت 13 Low-Latency Softwareالتكنولوجيا عبر الإنترنت 14 Networks, Hardware and Trading Infrastructureالتكنولوجيا عبر الإنترنت 15 Research, Data and Risk Platformsالتكنولوجيا عبر الإنترنت 16 The Desk and the Firmالشركة عبر الإنترنت 17 The Industry: Firms, Roles and Careersالمسارات المهنية عبر الإنترنت 18 The Interview Bookالمسارات المهنية عبر الإنترنت
التطبيقات حول المدرب تسجيل الدخول ابدأ القراءة

Quantitative Finance · المسرد

ما معنى Crisis alpha؟

Definition 19.5 Strategies I: Equities and Futures · الفصل 19 — Trend Following

Crisis alpha is a strategy’s tendency to earn positive returns during prolonged declines of the stock market, measured as its return over the market’s largest drawdowns; for trend following it comes from being short equities and positioned for the flight to quality once the decline has lasted longer than the signal’s lookback.
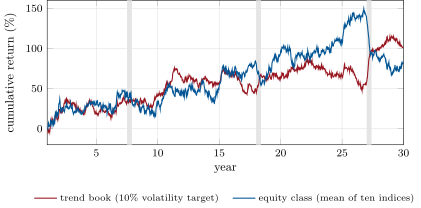
The blended trend book, targeted at 10% volatility, and the mean of the ten equity index futures on the synthetic universe, as cumulative sums of daily excess returns; the shaded bands are the three planted stock crashes. Data: s1_trend.paths.
Figure 19.2. The blended trend book, targeted at 10% volatility, and the mean of the ten equity index futures on the synthetic universe, as cumulative sums of daily excess returns; the shaded bands are the three planted stock crashes. Data: s1_trend.paths.
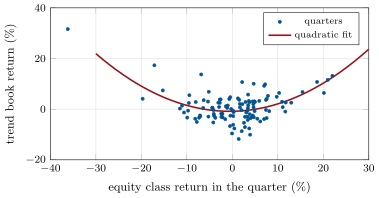
The trend smile: the blended trend book’s quarterly return (10% volatility target) against the equity class’s, 115 quarters of the synthetic universe, with a fitted quadratic (curvature 2.63). Data: s1_trend.smile.
Figure 19.3. The trend smile: the blended trend book’s quarterly return (10% volatility target) against the equity class’s, 115 quarters of the synthetic universe, with a fitted quadratic (curvature 2.63). Data: s1_trend.smile.
اقرأ في الفصل →