 المدرب
A decrement index is built on a total-return index by deducting a fixed amount, a percentage a year or a number of points, in place of the dividends actually paid: its forward depends on that fixed deduction, not on uncertain dividend forecasts.
أمثلة
Example 19.12 (Options on a 10% volatility-target index)
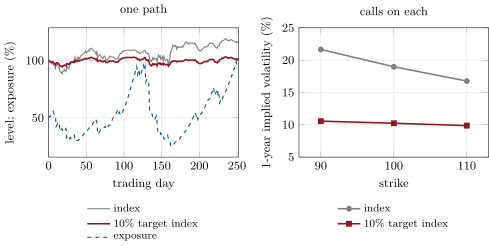
On chapter 10’s Heston model, fitted to chapter 9’s surface, build a 10% volatility-target index with exponentially weighted volatility estimates and leverage capped at 1.5, with zero rates. Over one year the raw index realises 19.8% on average, with a standard deviation of 8.2 points across paths. The target index realises 10.1%, with a standard deviation of 0.6 point. A one-year at-the-money call costs 7.54 on the raw index and 4.07 on the target index, and the implied volatilities are 19.0% and 10.2%. The raw index’s skew, from 21.6% at 90 to 16.8% at 110, nearly vanishes on the target index, 10.6% to 9.9% (Figure 19.3).
Example 19.13 (A decrement index against dividends)
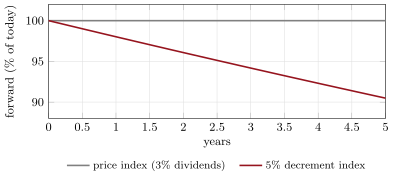
Take a 3% rate. A price index paying 3% dividends has a five-year forward of 100. A 5% decrement index built on the same total-return index has a forward of 90.5, since it loses 2% a year relative to it (Figure 19.4). A five-year at-the-money put at 20% volatility costs 15.2 per 100 on the price index and 19.0 on the decrement index, 24% more. That is what an investor who sells the put inside an autocallable receives in exchange for bearing the gap between the decrement and the dividends actually paid.