
جميع الكتب

مهني

1 Markets I: The Ecosystem and Exchange-Traded Marketsالأسواق عبر الإنترنت 2 Markets II: Rates, FX and Creditالأسواق عبر الإنترنت 3 Markets III: Commodities, Energy and Cryptoالأسواق عبر الإنترنت 4 Quantitative Methodsالأساليب عبر الإنترنت 5 Derivatives and Volatilityالمشتقات عبر الإنترنت 6 Rates, Credit, XVA and Riskالفائدة والائتمان والمخاطر عبر الإنترنت 7 Research Craft: Predictors, Backtests, Measurement, Portfoliosالبحث عبر الإنترنت 8 Strategies I: Equities and Futuresالاستراتيجيات عبر الإنترنت 9 Strategies II: Volatility, Relative Value, Macro and the Bank Desksالاستراتيجيات عبر الإنترنت 10 Microstructure and Executionالتنفيذ عبر الإنترنت 11 Market Making and High-Frequency Tradingصناعة السوق عبر الإنترنت 12 Machine Learning for Marketsتعلم الآلة عبر الإنترنت 13 Low-Latency Softwareالتكنولوجيا عبر الإنترنت 14 Networks, Hardware and Trading Infrastructureالتكنولوجيا عبر الإنترنت 15 Research, Data and Risk Platformsالتكنولوجيا عبر الإنترنت 16 The Desk and the Firmالشركة عبر الإنترنت 17 The Industry: Firms, Roles and Careersالمسارات المهنية عبر الإنترنت 18 The Interview Bookالمسارات المهنية عبر الإنترنت
التطبيقات حول المدرب تسجيل الدخول ابدأ القراءة

Quantitative Finance · المسرد

ما معنى Integrity scenario؟

Definition 28.4 The Interview Book · الفصل 28 — Behavioural and Fit

An integrity scenario is an interview question that describes a situation with a conflict between a candidate’s interest and a rule or duty (possible inside information, an error that only the candidate has seen, pressure to present a result one doubts) and asks what the candidate would do.
Average number of trading days between daily losses of at least k standard deviations, when daily P&L is normal or follows a Student t distribution scaled to the same standard deviation. A three-standard-deviation loss comes once in 741 days under the normal and once in 144 under the t with three degrees of freedom; at five standard deviations the gap is a factor of several thousand. Data: fig_iv_tails.py.
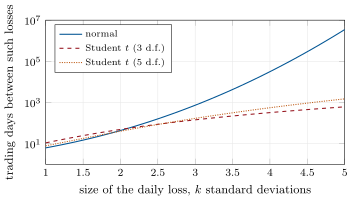
Figure 28.1. Average number of trading days between daily losses of at least kk standard deviations, when daily P&L is normal or follows a Student tt distribution scaled to the same standard deviation. A three-standard-deviation loss comes once in 741 days under the normal and once in 144 under the tt with three degrees of freedom; at five standard deviations the gap is a factor of several thousand. Data: fig_iv_tails.py.
اقرأ في الفصل →