
Alle boeken

Professioneel

Apps Over Coach Inloggen Begin met lezen

Quantitative Finance · Begrippenlijst

Wat is Intrinsic spread, index skew?

Ook bekend als: intrinsic spread · index skew

Definition 24.2 Markets II: Rates, FX and Credit · Hoofdstuk 24 — Credit Indices and Tranches

The intrinsic spread of an index is the spread that, converted with the index’s coupon and conventions, gives the weighted average of its constituents’ upfronts at that coupon. The index skew is the index’s quoted spread minus its intrinsic spread.
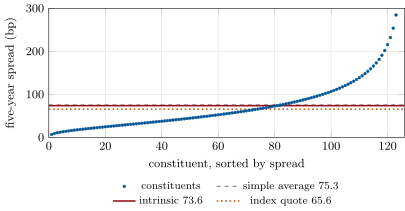
The constituents of a stylised 125-name investment-grade index, sorted by five-year spread (the two widest, at 335 and 459 basis points, are off the chart). The intrinsic spread is below the simple average because wide names carry smaller annuities; an index quoted at 65.6 trades 8 basis points through its intrinsic value. Illustrative; data: the chapter’s tutorial.
Figure 24.1. The constituents of a stylised 125-name investment-grade index, sorted by five-year spread (the two widest, at 335 and 459 basis points, are off the chart). The intrinsic spread is below the simple average because wide names carry smaller annuities; an index quoted at 65.6 trades 8 basis points through its intrinsic value. Illustrative; data: the chapter’s tutorial.
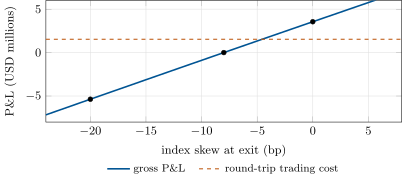
P&L of a USD 1 billion skew trade entered at a skew of -8 basis points (buy index protection, sell protection on the constituents) against the skew at exit, constituents unchanged. The trade gains USD 3.55 million if the skew closes and loses USD 5.37 million if it widens to -20 first; the dashed line is the cost of entering and leaving both legs. Illustrative; data: the chapter’s weekend problem.
Figure 24.2. P&L of a USD 1 billion skew trade entered at a skew of −8-8 basis points (buy index protection, sell protection on the constituents) against the skew at exit, constituents unchanged. The trade gains USD 3.55 million if the skew closes and loses USD 5.37 million if it widens to −20-20 first; the dashed line is the cost of entering and leaving both legs. Illustrative; data: the chapter’s weekend problem.

Voorbeelden

Example 24.4 (A stylised index)

Take 125 names whose five-year spreads are spread log-normally around a median of 55 basis points, from 6.6 to 459, with a simple average of 75.3. With a flat rate of 4% and a recovery of 40%, their average upfront at the 100 basis point coupon is −1.157%-1.157\%, which converts to an intrinsic spread of 73.6 basis points; the annuity-weighted average of the spreads is also 73.6. If the index trades at 65.6, its skew is −8-8 basis points (Figure 24.1).

Example 24.7 (Tranche losses)

For the stylised index, the five-year default probability implied by the intrinsic spread is 5.95%, and the portfolio’s expected loss 3.57%. With ρ=0.3\rho = 0.3 the expected losses are 59.6% of the equity tranche, 24.1% of the mezzanine, 7.83% of the senior and 0.22% of the super senior; weighted by their widths, 3, 4, 8 and 85%, they add up to 3.57%. The equity’s expected loss is 64.0% at ρ=0.25\rho = 0.25, and inverting the model at that value returns a base correlation of 25%. The mezzanine’s is 24.3% at ρ=0.10\rho = 0.10, 25.0% at 0.20 and 21.9% at 0.45: it is 24.3% again at 0.28.

Lees in het hoofdstuk →