
جميع الكتب

مهني

1 Markets I: The Ecosystem and Exchange-Traded Marketsالأسواق عبر الإنترنت 2 Markets II: Rates, FX and Creditالأسواق عبر الإنترنت 3 Markets III: Commodities, Energy and Cryptoالأسواق عبر الإنترنت 4 Quantitative Methodsالأساليب عبر الإنترنت 5 Derivatives and Volatilityالمشتقات عبر الإنترنت 6 Rates, Credit, XVA and Riskالفائدة والائتمان والمخاطر عبر الإنترنت 7 Research Craft: Predictors, Backtests, Measurement, Portfoliosالبحث عبر الإنترنت 8 Strategies I: Equities and Futuresالاستراتيجيات عبر الإنترنت 9 Strategies II: Volatility, Relative Value, Macro and the Bank Desksالاستراتيجيات عبر الإنترنت 10 Microstructure and Executionالتنفيذ عبر الإنترنت 11 Market Making and High-Frequency Tradingصناعة السوق عبر الإنترنت 12 Machine Learning for Marketsتعلم الآلة عبر الإنترنت 13 Low-Latency Softwareالتكنولوجيا عبر الإنترنت 14 Networks, Hardware and Trading Infrastructureالتكنولوجيا عبر الإنترنت 15 Research, Data and Risk Platformsالتكنولوجيا عبر الإنترنت 16 The Desk and the Firmالشركة عبر الإنترنت 17 The Industry: Firms, Roles and Careersالمسارات المهنية عبر الإنترنت 18 The Interview Bookالمسارات المهنية عبر الإنترنت
التطبيقات حول المدرب تسجيل الدخول ابدأ القراءة

Quantitative Finance · المسرد

ما معنى Japan Korea Marker؟

Definition 4.8 Markets III: Commodities, Energy and Crypto · الفصل 4 — Natural Gas and LNG

The Japan Korea Marker (JKM) is a price-reporting agency’s daily assessment of spot LNG cargoes delivered ex-ship into Japan, South Korea, China and Taiwan, the main Asian spot benchmark.

The LNG chain of a US export cargo, with the cost each link adds. The netback is the destination price less the right-hand costs; the cargo is lifted if the netback covers the variable price at liquefaction. Schematic.
Figure 4.2. The LNG chain of a US export cargo, with the cost each link adds. The netback is the destination price less the right-hand costs; the cargo is lifted if the netback covers the variable price at liquefaction. Schematic.
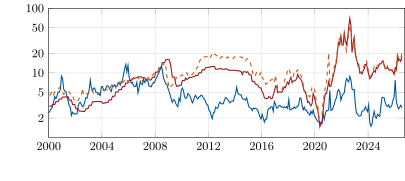
Monthly averages of three gas benchmarks, January 2000 to July 2026, on a log scale. US gas decoupled from the rest of the world after 2009; Europe peaked at 69.98\,\$/ MMBtu in August 2022. Data: FRED series MHHNGSP (US Energy Information Administration), PNGASEUUSDM and PNGASJPUSDM (International Monetary Fund).
Figure 4.3. Monthly averages of three gas benchmarks, January 2000 to July 2026, on a log scale. US gas decoupled from the rest of the world after 2009; Europe peaked at 69.98 $/MMBtu69.98\,\$/\mathrm{MMBtu} in August 2022. Data: FRED series MHHNGSP (US Energy Information Administration), PNGASEUUSDM and PNGASJPUSDM (International Monetary Fund).

أمثلة

Example 4.9 (Europe or Asia)

Take a cargo of 3.5 million MMBtu, a charter rate of $60 000 a day, boil-off of 0.1% a day, and one-way voyages of 14 days to north-west Europe and 25 to north Asia (illustrative, but close to the 14 days from Corpus Christi to Rotterdam and 28 to Hong Kong through Panama that the Oxford Institute for Energy Studies gives), with regasification at 0.50 0.50\, and 0.40 $/MMBtu0.40\,\$/\mathrm{MMBtu}. With Henry Hub at 3.00 3.00\, the variable price is 3.45 $/MMBtu3.45\,\$/\mathrm{MMBtu}; shipping costs 0.54 0.54\, to Europe and 0.97 $/MMBtu0.97\,\$/\mathrm{MMBtu} to Asia, so Asia must pay 0.33 $/MMBtu0.33\,\$/\mathrm{MMBtu} more than Europe to win the cargo. At 12.00 12.00\, in Europe and 12.50 12.50\, in Asia the netbacks are 10.96 10.96\, and 11.13 $/MMBtu11.13\,\$/\mathrm{MMBtu}: Asia.

اقرأ في الفصل →