جميع الكتب

مهني

1 Markets I: The Ecosystem and Exchange-Traded Marketsالأسواق عبر الإنترنت 2 Markets II: Rates, FX and Creditالأسواق عبر الإنترنت 3 Markets III: Commodities, Energy and Cryptoالأسواق عبر الإنترنت 4 Quantitative Methodsالأساليب عبر الإنترنت 5 Derivatives and Volatilityالمشتقات عبر الإنترنت 6 Rates, Credit, XVA and Riskالفائدة والائتمان والمخاطر عبر الإنترنت 7 Research Craft: Predictors, Backtests, Measurement, Portfoliosالبحث عبر الإنترنت 8 Strategies I: Equities and Futuresالاستراتيجيات عبر الإنترنت 9 Strategies II: Volatility, Relative Value, Macro and the Bank Desksالاستراتيجيات عبر الإنترنت 10 Microstructure and Executionالتنفيذ عبر الإنترنت 11 Market Making and High-Frequency Tradingصناعة السوق عبر الإنترنت 12 Machine Learning for Marketsتعلم الآلة عبر الإنترنت 13 Low-Latency Softwareالتكنولوجيا عبر الإنترنت 14 Networks, Hardware and Trading Infrastructureالتكنولوجيا عبر الإنترنت 15 Research, Data and Risk Platformsالتكنولوجيا عبر الإنترنت 16 The Desk and the Firmالشركة عبر الإنترنت 17 The Industry: Firms, Roles and Careersالمسارات المهنية عبر الإنترنت 18 The Interview Bookالمسارات المهنية عبر الإنترنت
التطبيقات حول المدرب تسجيل الدخول ابدأ القراءة

Quantitative Finance · المسرد

ما معنى Johansen test؟

Definition 20.8 Quantitative Methods · الفصل 20 — Multivariate Series and Cointegration

The Johansen test (Johansen, 1988, 1991) estimates the VECM by maximum likelihood under the restriction rank⁡Π=r\operatorname{rank}\Pi = r: after removing the short-run dynamics from ΔYt\Delta Y_t and Yt−1Y_{t-1}, the squared canonical correlations λ^1≥⋯≥λ^k\hat\lambda_1 \ge \dots \ge \hat\lambda_k between the two residual sets give the trace statistic −T∑i>rln⁡(1−λ^i)-T\sum_{i>r}\ln(1 - \hat\lambda_i) for rank at most rr, and the maximum-eigenvalue statistic −Tln⁡(1−λ^r+1)-T\ln(1 - \hat\lambda_{r+1}); the corresponding eigenvectors estimate β\beta.

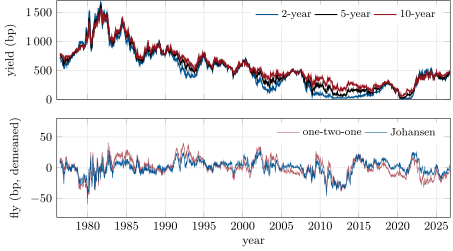
Top: the 2-, 5- and 10-year Treasury yields, 1976–2026, each indistinguishable from a random walk. Bottom: two flies, long the 5-year and short the wings, with the 5-year weight one: the one-two-one weights (0.5, 0.5) and the Johansen weights (0.41, 0.61), whose half-lives are 63 and 43 trading days. Data: FRED series DGS2, DGS5 and DGS10 (H.15).
Figure 20.3. Top: the 2-, 5- and 10-year Treasury yields, 1976–2026, each indistinguishable from a random walk. Bottom: two flies, long the 5-year and short the wings, with the 5-year weight one: the one-two-one weights (0.5, 0.5) and the Johansen weights (0.41, 0.61), whose half-lives are 63 and 43 trading days. Data: FRED series DGS2, DGS5 and DGS10 (H.15).
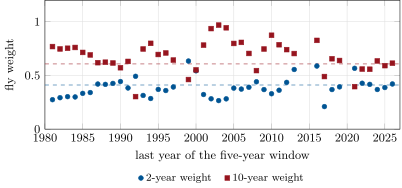
Johansen fly weights (per unit of the 5-year) estimated on rolling five-year windows, with the full-sample values 0.41 and 0.61 (dashed). Four windows whose weights exceed 1.5 in absolute value are not shown; in 20 of the 46 windows the trace test does not find cointegration at 5%. Data: FRED series DGS2, DGS5 and DGS10 (H.15).
Figure 20.4. Johansen fly weights (per unit of the 5-year) estimated on rolling five-year windows, with the full-sample values 0.41 and 0.61 (dashed). Four windows whose weights exceed 1.5 in absolute value are not shown; in 20 of the 46 windows the trace test does not find cointegration at 5%. Data: FRED series DGS2, DGS5 and DGS10 (H.15).
اقرأ في الفصل →