
Todos os livros

Profissional

Apps Sobre Coach Entrar Começar a ler

Quantitative Finance · Glossário

O que é Mark-out curve?

Definition 23.1 Research Craft: Predictors, Backtests, Measurement, Portfolios · Capítulo 23 — Measuring Market Making and Execution

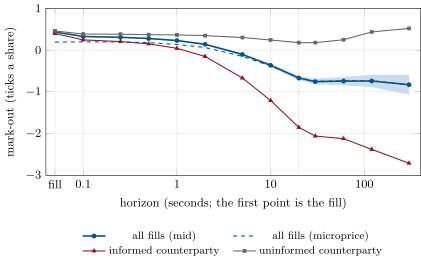
The mark-out curve of a set of fills is the quantity-weighted average, as a function of the horizon hh, of each fill’s mark-out (Book 2, chapter 15), si (m(ti+h)−pi)s_i\,(m(t_i + h) - p_i) for a fill of side sis_i at price pip_i and time tit_i, against a reference price mm: the mid, or the microprice (chapter 8).
Mark-out curves of the touch quoter’s fills over twelve simulated hours, with a two-standard-error band for all fills. The dotted line marks twenty seconds, where the curve settles. Data: rs_markout.curves.
Figure 23.1. Mark-out curves of the touch quoter’s fills over twelve simulated hours, with a two-standard-error band for all fills. The dotted line marks twenty seconds, where the curve settles. Data: rs_markout.curves.
Ler no capítulo →