
جميع الكتب

مهني

1 Markets I: The Ecosystem and Exchange-Traded Marketsالأسواق عبر الإنترنت 2 Markets II: Rates, FX and Creditالأسواق عبر الإنترنت 3 Markets III: Commodities, Energy and Cryptoالأسواق عبر الإنترنت 4 Quantitative Methodsالأساليب عبر الإنترنت 5 Derivatives and Volatilityالمشتقات عبر الإنترنت 6 Rates, Credit, XVA and Riskالفائدة والائتمان والمخاطر عبر الإنترنت 7 Research Craft: Predictors, Backtests, Measurement, Portfoliosالبحث عبر الإنترنت 8 Strategies I: Equities and Futuresالاستراتيجيات عبر الإنترنت 9 Strategies II: Volatility, Relative Value, Macro and the Bank Desksالاستراتيجيات عبر الإنترنت 10 Microstructure and Executionالتنفيذ عبر الإنترنت 11 Market Making and High-Frequency Tradingصناعة السوق عبر الإنترنت 12 Machine Learning for Marketsتعلم الآلة عبر الإنترنت 13 Low-Latency Softwareالتكنولوجيا عبر الإنترنت 14 Networks, Hardware and Trading Infrastructureالتكنولوجيا عبر الإنترنت 15 Research, Data and Risk Platformsالتكنولوجيا عبر الإنترنت 16 The Desk and the Firmالشركة عبر الإنترنت 17 The Industry: Firms, Roles and Careersالمسارات المهنية عبر الإنترنت 18 The Interview Bookالمسارات المهنية عبر الإنترنت
التطبيقات حول المدرب تسجيل الدخول ابدأ القراءة

Quantitative Finance · المسرد

ما معنى Multiple testing, data snooping, garden of forking paths؟

يُعرف أيضًا باسم: multiple testing · data snooping · garden of forking paths

Definition 12.7 Quantitative Methods · الفصل 12 — Testing and Multiple Testing

Multiple testing is running many tests and reporting some of them. Data snooping is choosing a model, a strategy or a parameter by searching over the same data that then test it, so that the reported statistic is the best of a search presented as a single test. The garden of forking paths is the implicit version: every choice the analyst would have made differently had the data been different (the sample period, the universe, the filter, the cost model) multiplies the tests actually run, even when only one analysis is ever performed.
Probability that the largest t-statistic reaches c when nothing works: one test, the two hundred momentum variants of the tutorial (Gaussian simulation with their estimated correlation), and two hundred independent tests. At the best variant’s 3.11 (vertical line): 0.0009, 0.030 and 0.17. Data: the chapter’s tutorial, seeded.
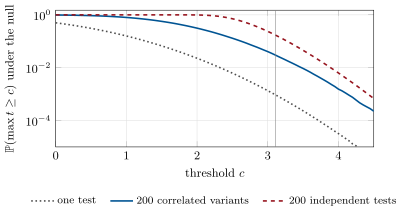
Figure 12.2. Probability that the largest tt-statistic reaches cc when nothing works: one test, the two hundred momentum variants of the tutorial (Gaussian simulation with their estimated correlation), and two hundred independent tests. At the best variant’s 3.11 (vertical line): 0.0009, 0.030 and 0.17. Data: the chapter’s tutorial, seeded.
The t-statistics of the two hundred trend rules on one simulated ten-year random walk, against their lookback, with three one-sided 5% thresholds: a single test (1.645), the max-statistic critical value for this correlated family (2.92) and Bonferroni’s (3.48). The best rule, at 42 days, has t = 3.11. Data: the chapter’s tutorial, seeded.
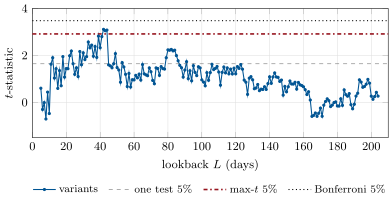
Figure 12.3. The tt-statistics of the two hundred trend rules on one simulated ten-year random walk, against their lookback, with three one-sided 5% thresholds: a single test (1.645), the max-statistic critical value for this correlated family (2.92) and Bonferroni’s (3.48). The best rule, at 42 days, has t=3.11t = 3.11. Data: the chapter’s tutorial, seeded.
اقرأ في الفصل →