جميع الكتب

مهني

1 Markets I: The Ecosystem and Exchange-Traded Marketsالأسواق عبر الإنترنت 2 Markets II: Rates, FX and Creditالأسواق عبر الإنترنت 3 Markets III: Commodities, Energy and Cryptoالأسواق عبر الإنترنت 4 Quantitative Methodsالأساليب عبر الإنترنت 5 Derivatives and Volatilityالمشتقات عبر الإنترنت 6 Rates, Credit, XVA and Riskالفائدة والائتمان والمخاطر عبر الإنترنت 7 Research Craft: Predictors, Backtests, Measurement, Portfoliosالبحث عبر الإنترنت 8 Strategies I: Equities and Futuresالاستراتيجيات عبر الإنترنت 9 Strategies II: Volatility, Relative Value, Macro and the Bank Desksالاستراتيجيات عبر الإنترنت 10 Microstructure and Executionالتنفيذ عبر الإنترنت 11 Market Making and High-Frequency Tradingصناعة السوق عبر الإنترنت 12 Machine Learning for Marketsتعلم الآلة عبر الإنترنت 13 Low-Latency Softwareالتكنولوجيا عبر الإنترنت 14 Networks, Hardware and Trading Infrastructureالتكنولوجيا عبر الإنترنت 15 Research, Data and Risk Platformsالتكنولوجيا عبر الإنترنت 16 The Desk and the Firmالشركة عبر الإنترنت 17 The Industry: Firms, Roles and Careersالمسارات المهنية عبر الإنترنت 18 The Interview Bookالمسارات المهنية عبر الإنترنت
التطبيقات حول المدرب تسجيل الدخول ابدأ القراءة

Quantitative Finance · المسرد

ما معنى Nelson–Siegel and Svensson curves؟

يُعرف أيضًا باسم: Nelson--Siegel curve

Definition 1.8 Rates, Credit, XVA and Risk · الفصل 1 — Curve Construction

A Nelson–Siegel curve is the zero curve

z(T)=β0+β1 1−e−T/τ1T/τ1+β2(1−e−T/τ1T/τ1−e−T/τ1),z(T) = \beta_0 + \beta_1\,\frac{1-e^{-T/\tau_1}}{T/\tau_1} + \beta_2\Bigl(\frac{1-e^{-T/\tau_1}}{T/\tau_1}-e^{-T/\tau_1}\Bigr),

with long-run level β0\beta_0, short end β0+β1\beta_0+\beta_1 and a hump of size β2\beta_2 near τ1\tau_1; its forward curve is f(0,T)=β0+β1e−T/τ1+β2(T/τ1)e−T/τ1f(0,T) = \beta_0 + \beta_1 e^{-T/\tau_1} + \beta_2 (T/\tau_1)e^{-T/\tau_1}. Svensson’s extension adds a second hump term β3\beta_3 with its own τ2\tau_2.

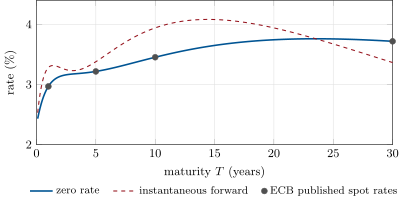
The euro-area AAA government curve of 22 September 2026, from the six Svensson parameters the ECB publishes; the dots are the spot rates the ECB publishes for one, five, ten and thirty years, which the formula reproduces. Source: ECB statistics (ECB Data Portal, series YC.B.U2.EUR.4F.G_N_A.SV_C_YM).
Figure 1.3. The euro-area AAA government curve of 22 September 2026, from the six Svensson parameters the ECB publishes; the dots are the spot rates the ECB publishes for one, five, ten and thirty years, which the formula reproduces. Source: ECB statistics (ECB Data Portal, series YC.B.U2.EUR.4F.G_N_A.SV_C_YM).

أمثلة

Example 1.9 (The ECB’s AAA curve)

On 22 September 2026 the ECB’s AAA Svensson parameters were β0=1.6306\beta_0=1.6306, β1=0.6958\beta_1=0.6958, β2=2.5849\beta_2=2.5849, β3=6.6622\beta_3=6.6622 (per cent), τ1=1.0632\tau_1=1.0632, τ2=14.4456\tau_2=14.4456 years. They give a ten-year zero rate of 3.4527%3.4527\%, which is the ECB’s published ten-year spot rate, and the one-, five- and thirty-year published rates to six decimals; the instantaneous forward rises from 2.33%2.33\% at the short end to a peak of 4.08%4.08\% near fourteen years (Figure 1.3).

اقرأ في الفصل →