Tous les livres

Professionnel

Applis À propos Coach Connexion Commencer la lecture

Quantitative Finance · Glossaire

Qu'est-ce que « Nelson–Siegel and Svensson curves » ?

Aussi appelé : Nelson--Siegel curve

Definition 1.8 Rates, Credit, XVA and Risk · Chapitre 1 — Curve Construction

A Nelson–Siegel curve is the zero curve

z(T)=β0+β1 1−e−T/τ1T/τ1+β2(1−e−T/τ1T/τ1−e−T/τ1),z(T) = \beta_0 + \beta_1\,\frac{1-e^{-T/\tau_1}}{T/\tau_1} + \beta_2\Bigl(\frac{1-e^{-T/\tau_1}}{T/\tau_1}-e^{-T/\tau_1}\Bigr),

with long-run level β0\beta_0, short end β0+β1\beta_0+\beta_1 and a hump of size β2\beta_2 near τ1\tau_1; its forward curve is f(0,T)=β0+β1e−T/τ1+β2(T/τ1)e−T/τ1f(0,T) = \beta_0 + \beta_1 e^{-T/\tau_1} + \beta_2 (T/\tau_1)e^{-T/\tau_1}. Svensson’s extension adds a second hump term β3\beta_3 with its own τ2\tau_2.

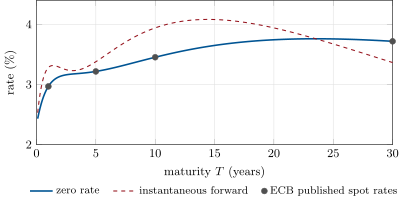
The euro-area AAA government curve of 22 September 2026, from the six Svensson parameters the ECB publishes; the dots are the spot rates the ECB publishes for one, five, ten and thirty years, which the formula reproduces. Source: ECB statistics (ECB Data Portal, series YC.B.U2.EUR.4F.G_N_A.SV_C_YM).
Figure 1.3. The euro-area AAA government curve of 22 September 2026, from the six Svensson parameters the ECB publishes; the dots are the spot rates the ECB publishes for one, five, ten and thirty years, which the formula reproduces. Source: ECB statistics (ECB Data Portal, series YC.B.U2.EUR.4F.G_N_A.SV_C_YM).

Exemples

Example 1.9 (The ECB’s AAA curve)

On 22 September 2026 the ECB’s AAA Svensson parameters were β0=1.6306\beta_0=1.6306, β1=0.6958\beta_1=0.6958, β2=2.5849\beta_2=2.5849, β3=6.6622\beta_3=6.6622 (per cent), τ1=1.0632\tau_1=1.0632, τ2=14.4456\tau_2=14.4456 years. They give a ten-year zero rate of 3.4527%3.4527\%, which is the ECB’s published ten-year spot rate, and the one-, five- and thirty-year published rates to six decimals; the instantaneous forward rises from 2.33%2.33\% at the short end to a peak of 4.08%4.08\% near fourteen years (Figure 1.3).

Lire dans le chapitre →