جميع الكتب

مهني

1 Markets I: The Ecosystem and Exchange-Traded Marketsالأسواق عبر الإنترنت 2 Markets II: Rates, FX and Creditالأسواق عبر الإنترنت 3 Markets III: Commodities, Energy and Cryptoالأسواق عبر الإنترنت 4 Quantitative Methodsالأساليب عبر الإنترنت 5 Derivatives and Volatilityالمشتقات عبر الإنترنت 6 Rates, Credit, XVA and Riskالفائدة والائتمان والمخاطر عبر الإنترنت 7 Research Craft: Predictors, Backtests, Measurement, Portfoliosالبحث عبر الإنترنت 8 Strategies I: Equities and Futuresالاستراتيجيات عبر الإنترنت 9 Strategies II: Volatility, Relative Value, Macro and the Bank Desksالاستراتيجيات عبر الإنترنت 10 Microstructure and Executionالتنفيذ عبر الإنترنت 11 Market Making and High-Frequency Tradingصناعة السوق عبر الإنترنت 12 Machine Learning for Marketsتعلم الآلة عبر الإنترنت 13 Low-Latency Softwareالتكنولوجيا عبر الإنترنت 14 Networks, Hardware and Trading Infrastructureالتكنولوجيا عبر الإنترنت 15 Research, Data and Risk Platformsالتكنولوجيا عبر الإنترنت 16 The Desk and the Firmالشركة عبر الإنترنت 17 The Industry: Firms, Roles and Careersالمسارات المهنية عبر الإنترنت 18 The Interview Bookالمسارات المهنية عبر الإنترنت
التطبيقات حول المدرب تسجيل الدخول ابدأ القراءة

Quantitative Finance · المسرد

ما معنى Probability of backtest overfitting, combinatorially symmetric cross-validation؟

يُعرف أيضًا باسم: probability of backtest overfitting · combinatorially symmetric cross-validation

Definition 20.2 Research Craft: Predictors, Backtests, Measurement, Portfolios · الفصل 20 — Overfitting

The probability of backtest overfitting (PBO) of a selection procedure is the probability that the strategy it selects as the best in sample performs below the median of the candidates out of sample. Combinatorially symmetric cross-validation (CSCV) estimates it by cutting the history into SS blocks and, for each choice of S/2S/2 blocks as the in-sample set, ranking the in-sample winner among all candidates on the other half; the PBO is the share of splits where its rank is below the median (Bailey, Borwein, López de Prado and Zhu).
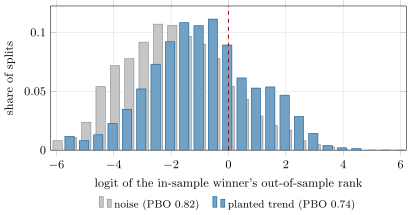
CSCV on the thousand trend systems’ search years (16 blocks, 3 000 splits): the distribution of the logit of the in-sample winner’s out-of-sample rank. Mass to the left of zero is the probability of backtest overfitting. Data: rs_overfit on synthetic returns.
Figure 20.1. CSCV on the thousand trend systems’ search years (16 blocks, 3 000 splits): the distribution of the logit of the in-sample winner’s out-of-sample rank. Mass to the left of zero is the probability of backtest overfitting. Data: rs_overfit on synthetic returns.
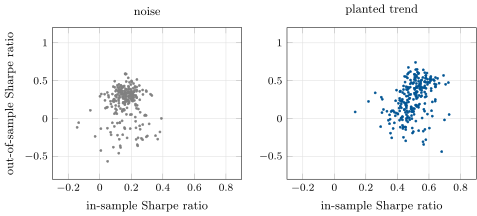
In-sample (17.9 years) against out-of-sample (5 years) Sharpe ratios of the trend systems (every fourth of the thousand). On noise the clouds are unrelated (correlation -0.05); with the trend they correlate at 0.33, yet the top in-sample system is not near the top out of sample. Data: rs_overfit.systems.
Figure 20.2. In-sample (17.9 years) against out-of-sample (5 years) Sharpe ratios of the trend systems (every fourth of the thousand). On noise the clouds are unrelated (correlation −0.05-0.05); with the trend they correlate at 0.33, yet the top in-sample system is not near the top out of sample. Data: rs_overfit.systems.
اقرأ في الفصل →