
جميع الكتب

مهني

1 Markets I: The Ecosystem and Exchange-Traded Marketsالأسواق عبر الإنترنت 2 Markets II: Rates, FX and Creditالأسواق عبر الإنترنت 3 Markets III: Commodities, Energy and Cryptoالأسواق عبر الإنترنت 4 Quantitative Methodsالأساليب عبر الإنترنت 5 Derivatives and Volatilityالمشتقات عبر الإنترنت 6 Rates, Credit, XVA and Riskالفائدة والائتمان والمخاطر عبر الإنترنت 7 Research Craft: Predictors, Backtests, Measurement, Portfoliosالبحث عبر الإنترنت 8 Strategies I: Equities and Futuresالاستراتيجيات عبر الإنترنت 9 Strategies II: Volatility, Relative Value, Macro and the Bank Desksالاستراتيجيات عبر الإنترنت 10 Microstructure and Executionالتنفيذ عبر الإنترنت 11 Market Making and High-Frequency Tradingصناعة السوق عبر الإنترنت 12 Machine Learning for Marketsتعلم الآلة عبر الإنترنت 13 Low-Latency Softwareالتكنولوجيا عبر الإنترنت 14 Networks, Hardware and Trading Infrastructureالتكنولوجيا عبر الإنترنت 15 Research, Data and Risk Platformsالتكنولوجيا عبر الإنترنت 16 The Desk and the Firmالشركة عبر الإنترنت 17 The Industry: Firms, Roles and Careersالمسارات المهنية عبر الإنترنت 18 The Interview Bookالمسارات المهنية عبر الإنترنت
التطبيقات حول المدرب تسجيل الدخول ابدأ القراءة

Quantitative Finance · المسرد

ما معنى Research portfolio, project scorecard؟

يُعرف أيضًا باسم: research portfolio · project scorecard

Definition 9.1 The Desk and the Firm · الفصل 9 — Managing Researchers, Traders and Engineers

A desk’s research portfolio is the set of research and development projects it funds in a period, chosen under a budget of money and people. A project scorecard records each candidate’s cost, probability of success, value if it succeeds (the present value of the P&L it adds, net of its running costs), its overlap with what the desk already runs, and the evidence behind each estimate.
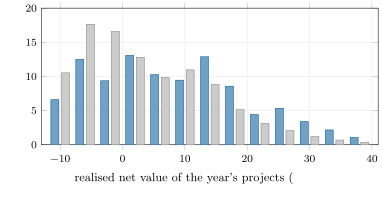
The distribution of a year’s realised net value from twelve candidate projects and a $10 million budget, chosen greedily by expected net value per dollar and at random; 20 000 simulated years, bins of $4 million. Most research years lose money on some projects; a good portfolio loses less often. Data: fm_research.portfolio_samples.
Figure 9.1. The distribution of a year’s realised net value from twelve candidate projects and a $10 million budget, chosen greedily by expected net value per dollar and at random; 20 000 simulated years, bins of $4 million. Most research years lose money on some projects; a good portfolio loses less often. Data: fm_research.portfolio_samples.
اقرأ في الفصل →