
جميع الكتب

مهني

1 Markets I: The Ecosystem and Exchange-Traded Marketsالأسواق عبر الإنترنت 2 Markets II: Rates, FX and Creditالأسواق عبر الإنترنت 3 Markets III: Commodities, Energy and Cryptoالأسواق عبر الإنترنت 4 Quantitative Methodsالأساليب عبر الإنترنت 5 Derivatives and Volatilityالمشتقات عبر الإنترنت 6 Rates, Credit, XVA and Riskالفائدة والائتمان والمخاطر عبر الإنترنت 7 Research Craft: Predictors, Backtests, Measurement, Portfoliosالبحث عبر الإنترنت 8 Strategies I: Equities and Futuresالاستراتيجيات عبر الإنترنت 9 Strategies II: Volatility, Relative Value, Macro and the Bank Desksالاستراتيجيات عبر الإنترنت 10 Microstructure and Executionالتنفيذ عبر الإنترنت 11 Market Making and High-Frequency Tradingصناعة السوق عبر الإنترنت 12 Machine Learning for Marketsتعلم الآلة عبر الإنترنت 13 Low-Latency Softwareالتكنولوجيا عبر الإنترنت 14 Networks, Hardware and Trading Infrastructureالتكنولوجيا عبر الإنترنت 15 Research, Data and Risk Platformsالتكنولوجيا عبر الإنترنت 16 The Desk and the Firmالشركة عبر الإنترنت 17 The Industry: Firms, Roles and Careersالمسارات المهنية عبر الإنترنت 18 The Interview Bookالمسارات المهنية عبر الإنترنت
التطبيقات حول المدرب تسجيل الدخول ابدأ القراءة

Quantitative Finance · المسرد

ما معنى Scanning range and risk array؟

يُعرف أيضًا باسم: scanning range

Definition 20.3 Markets I: The Ecosystem and Exchange-Traded Markets · الفصل 20 — Margin

In a scenario-based margin system the clearing house sets, for each product, a price scan range and a volatility scan range: the largest moves in price and in implied volatility it wishes to cover over its horizon, the scanning range. The risk array of a contract is its gain or loss under each of a fixed list of scenarios built from those ranges; the scan risk of a portfolio is its largest total loss over the list.
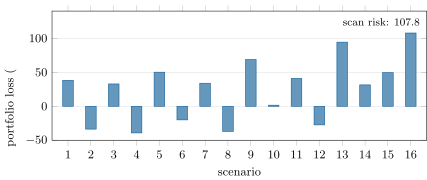
Sixteen scenarios for a portfolio long 2 futures at 6 000, short 10 puts struck at 5 600 and short 10 calls at 6 400 (three months, 18% volatility, price scan 345 points, volatility scan 4 points, extreme moves of three ranges counted at 30%). Odd scenarios raise volatility, even ones lower it. The margin is set by scenario 16, the extreme fall. Data: the chapter’s build.
Figure 20.1. Sixteen scenarios for a portfolio long 2 futures at 6 000, short 10 puts struck at 5 600 and short 10 calls at 6 400 (three months, 18% volatility, price scan 345 points, volatility scan 4 points, extreme moves of three ranges counted at 30%). Odd scenarios raise volatility, even ones lower it. The margin is set by scenario 16, the extreme fall. Data: the chapter’s build.
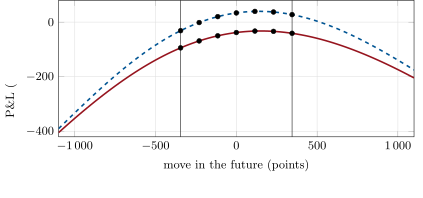
What the scan sees. The same portfolio revalued over a wide range of prices; the fourteen standard scenarios are the dots, all inside the price scan range (thin lines). The losses that matter for this portfolio lie outside it, which is what scenarios 15 and 16 are for.
Figure 20.2. What the scan sees. The same portfolio revalued over a wide range of prices; the fourteen standard scenarios are the dots, all inside the price scan range (thin lines). The losses that matter for this portfolio lie outside it, which is what scenarios 15 and 16 are for.

أمثلة

Example 20.4 (The risk array of one future)

A regulator’s review of the system prints the array of the large S&P 500 future on 12 April 2001, when its maintenance margin was $17 250: zero in the two volatility scenarios; losses of ∓$5 750\mp\$5\,750, ∓$11 500\mp\$11\,500 and ∓$17 250\mp\$17\,250 at one, two and three thirds; and in the extreme scenarios, a move of three times the range with 30% of the loss counted, ±$15 525\pm\$15\,525. A long future’s scan risk is the full move down, $17 250; the extreme scenario, at $15 525, does not bind. It binds for the option seller.

اقرأ في الفصل →