
Alle boeken

Professioneel

Apps Over Coach Inloggen Begin met lezen

Quantitative Finance · Begrippenlijst

Wat is Scanning range and risk array?

Ook bekend als: scanning range

Definition 20.3 Markets I: The Ecosystem and Exchange-Traded Markets · Hoofdstuk 20 — Margin

In a scenario-based margin system the clearing house sets, for each product, a price scan range and a volatility scan range: the largest moves in price and in implied volatility it wishes to cover over its horizon, the scanning range. The risk array of a contract is its gain or loss under each of a fixed list of scenarios built from those ranges; the scan risk of a portfolio is its largest total loss over the list.
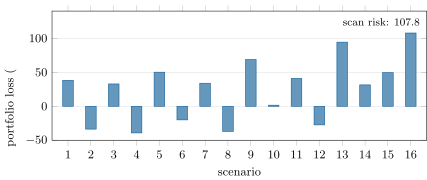
Sixteen scenarios for a portfolio long 2 futures at 6 000, short 10 puts struck at 5 600 and short 10 calls at 6 400 (three months, 18% volatility, price scan 345 points, volatility scan 4 points, extreme moves of three ranges counted at 30%). Odd scenarios raise volatility, even ones lower it. The margin is set by scenario 16, the extreme fall. Data: the chapter’s build.
Figure 20.1. Sixteen scenarios for a portfolio long 2 futures at 6 000, short 10 puts struck at 5 600 and short 10 calls at 6 400 (three months, 18% volatility, price scan 345 points, volatility scan 4 points, extreme moves of three ranges counted at 30%). Odd scenarios raise volatility, even ones lower it. The margin is set by scenario 16, the extreme fall. Data: the chapter’s build.
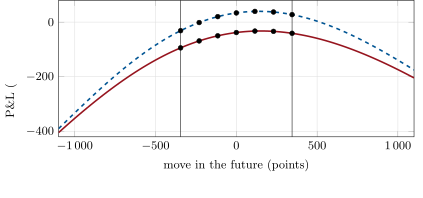
What the scan sees. The same portfolio revalued over a wide range of prices; the fourteen standard scenarios are the dots, all inside the price scan range (thin lines). The losses that matter for this portfolio lie outside it, which is what scenarios 15 and 16 are for.
Figure 20.2. What the scan sees. The same portfolio revalued over a wide range of prices; the fourteen standard scenarios are the dots, all inside the price scan range (thin lines). The losses that matter for this portfolio lie outside it, which is what scenarios 15 and 16 are for.

Voorbeelden

Example 20.4 (The risk array of one future)

A regulator’s review of the system prints the array of the large S&P 500 future on 12 April 2001, when its maintenance margin was $17 250: zero in the two volatility scenarios; losses of ∓$5 750\mp\$5\,750, ∓$11 500\mp\$11\,500 and ∓$17 250\mp\$17\,250 at one, two and three thirds; and in the extreme scenarios, a move of three times the range with 30% of the loss counted, ±$15 525\pm\$15\,525. A long future’s scan risk is the full move down, $17 250; the extreme scenario, at $15 525, does not bind. It binds for the option seller.

Lees in het hoofdstuk →