
جميع الكتب

مهني

1 Markets I: The Ecosystem and Exchange-Traded Marketsالأسواق عبر الإنترنت 2 Markets II: Rates, FX and Creditالأسواق عبر الإنترنت 3 Markets III: Commodities, Energy and Cryptoالأسواق عبر الإنترنت 4 Quantitative Methodsالأساليب عبر الإنترنت 5 Derivatives and Volatilityالمشتقات عبر الإنترنت 6 Rates, Credit, XVA and Riskالفائدة والائتمان والمخاطر عبر الإنترنت 7 Research Craft: Predictors, Backtests, Measurement, Portfoliosالبحث عبر الإنترنت 8 Strategies I: Equities and Futuresالاستراتيجيات عبر الإنترنت 9 Strategies II: Volatility, Relative Value, Macro and the Bank Desksالاستراتيجيات عبر الإنترنت 10 Microstructure and Executionالتنفيذ عبر الإنترنت 11 Market Making and High-Frequency Tradingصناعة السوق عبر الإنترنت 12 Machine Learning for Marketsتعلم الآلة عبر الإنترنت 13 Low-Latency Softwareالتكنولوجيا عبر الإنترنت 14 Networks, Hardware and Trading Infrastructureالتكنولوجيا عبر الإنترنت 15 Research, Data and Risk Platformsالتكنولوجيا عبر الإنترنت 16 The Desk and the Firmالشركة عبر الإنترنت 17 The Industry: Firms, Roles and Careersالمسارات المهنية عبر الإنترنت 18 The Interview Bookالمسارات المهنية عبر الإنترنت
التطبيقات حول المدرب تسجيل الدخول ابدأ القراءة

Quantitative Finance · المسرد

ما معنى Sticky strike and sticky delta؟

يُعرف أيضًا باسم: sticky strike · sticky delta

Definition 7.2 Derivatives and Volatility · الفصل 7 — Implied Volatility and Its Surface

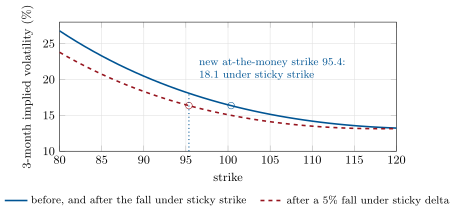
Under sticky strike the implied volatility of each strike and expiry stays fixed when the spot moves: the smile, drawn against strike, does not move. Under sticky delta (also sticky moneyness) the implied volatility of each moneyness K/FK/F stays fixed: the smile moves with the forward, and the at-the-money volatility does not change.
The three-month smile before and after a 5% fall of the index. Under sticky strike the curve stays where it was and the new at-the-money strike (95.4) reads 18.1 volatility on it; under sticky delta the curve shifts left with the forward and the at-the-money volatility stays at 16.4. Round markers: at-the-money points. Data: the tutorial.
Figure 7.3. The three-month smile before and after a 5% fall of the index. Under sticky strike the curve stays where it was and the new at-the-money strike (95.4) reads 18.1 volatility on it; under sticky delta the curve shifts left with the forward and the at-the-money volatility stays at 16.4. Round markers: at-the-money points. Data: the tutorial.
اقرأ في الفصل →