جميع الكتب

مهني

1 Markets I: The Ecosystem and Exchange-Traded Marketsالأسواق عبر الإنترنت 2 Markets II: Rates, FX and Creditالأسواق عبر الإنترنت 3 Markets III: Commodities, Energy and Cryptoالأسواق عبر الإنترنت 4 Quantitative Methodsالأساليب عبر الإنترنت 5 Derivatives and Volatilityالمشتقات عبر الإنترنت 6 Rates, Credit, XVA and Riskالفائدة والائتمان والمخاطر عبر الإنترنت 7 Research Craft: Predictors, Backtests, Measurement, Portfoliosالبحث عبر الإنترنت 8 Strategies I: Equities and Futuresالاستراتيجيات عبر الإنترنت 9 Strategies II: Volatility, Relative Value, Macro and the Bank Desksالاستراتيجيات عبر الإنترنت 10 Microstructure and Executionالتنفيذ عبر الإنترنت 11 Market Making and High-Frequency Tradingصناعة السوق عبر الإنترنت 12 Machine Learning for Marketsتعلم الآلة عبر الإنترنت 13 Low-Latency Softwareالتكنولوجيا عبر الإنترنت 14 Networks, Hardware and Trading Infrastructureالتكنولوجيا عبر الإنترنت 15 Research, Data and Risk Platformsالتكنولوجيا عبر الإنترنت 16 The Desk and the Firmالشركة عبر الإنترنت 17 The Industry: Firms, Roles and Careersالمسارات المهنية عبر الإنترنت 18 The Interview Bookالمسارات المهنية عبر الإنترنت
التطبيقات حول المدرب تسجيل الدخول ابدأ القراءة

Quantitative Finance · المسرد

ما معنى Turnover velocity؟

Definition 29.1 Markets III: Commodities, Energy and Crypto · الفصل 29 — A Map of All Markets

The turnover velocity of a market is its daily turnover divided by the amount of the asset outstanding (or, for derivatives, the open interest): the share of the stock that changes hands each day.
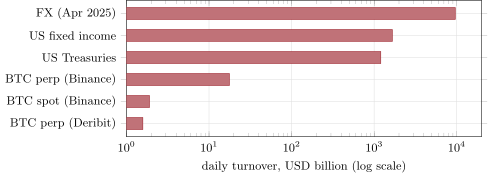

Daily turnover of six markets on one logarithmic scale. The measures differ (the BIS counts all FX instruments net of double counting in April 2025; SIFMA averages US trading for 2026 to August; the crypto figures are one day’s volume on single venues), and the gap between the largest and the smallest is nearly four orders of magnitude. Data: .
Figure 29.1. Daily turnover of six markets on one logarithmic scale. The measures differ (the BIS counts all FX instruments net of double counting in April 2025; SIFMA averages US trading for 2026 to August; the crypto figures are one day’s volume on single venues), and the gap between the largest and the smallest is nearly four orders of magnitude. Data: Box 29.1.
اقرأ في الفصل →