
جميع الكتب

مهني

1 Markets I: The Ecosystem and Exchange-Traded Marketsالأسواق عبر الإنترنت 2 Markets II: Rates, FX and Creditالأسواق عبر الإنترنت 3 Markets III: Commodities, Energy and Cryptoالأسواق عبر الإنترنت 4 Quantitative Methodsالأساليب عبر الإنترنت 5 Derivatives and Volatilityالمشتقات عبر الإنترنت 6 Rates, Credit, XVA and Riskالفائدة والائتمان والمخاطر عبر الإنترنت 7 Research Craft: Predictors, Backtests, Measurement, Portfoliosالبحث عبر الإنترنت 8 Strategies I: Equities and Futuresالاستراتيجيات عبر الإنترنت 9 Strategies II: Volatility, Relative Value, Macro and the Bank Desksالاستراتيجيات عبر الإنترنت 10 Microstructure and Executionالتنفيذ عبر الإنترنت 11 Market Making and High-Frequency Tradingصناعة السوق عبر الإنترنت 12 Machine Learning for Marketsتعلم الآلة عبر الإنترنت 13 Low-Latency Softwareالتكنولوجيا عبر الإنترنت 14 Networks, Hardware and Trading Infrastructureالتكنولوجيا عبر الإنترنت 15 Research, Data and Risk Platformsالتكنولوجيا عبر الإنترنت 16 The Desk and the Firmالشركة عبر الإنترنت 17 The Industry: Firms, Roles and Careersالمسارات المهنية عبر الإنترنت 18 The Interview Bookالمسارات المهنية عبر الإنترنت
التطبيقات حول المدرب تسجيل الدخول ابدأ القراءة

Quantitative Finance · المسرد

ما معنى Zero-coupon rate, par yield, STRIPS؟

يُعرف أيضًا باسم: zero-coupon rate · par yield · STRIPS

Definition 3.12 Markets II: Rates, FX and Credit · الفصل 3 — Government Bonds

The zero-coupon rate z(T)z(T) for maturity TT is the yield of a single payment at TT: P(0,T)=(1+z/f)−fTP(0,T) = (1 + z/f)^{-fT}. The par yield for TT is the coupon that would price a bond maturing at TT at 100. STRIPS are the US Treasury’s zero-coupon securities, created by separating an eligible note or bond into its individual coupon and principal payments, each of which then trades on its own; a complete set can be reassembled into the original security.
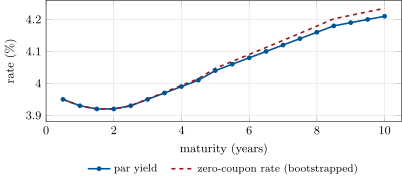
An illustrative par curve and the zero curve bootstrapped from it (). Where the par curve rises, the zero curve lies above it, because a coupon bond’s yield averages the zero rates of all its payments, most of them earlier and lower; where the par curve dips, at one to two years, the zero curve dips below it. Data: the chapter’s tutorial.
Figure 3.3. An illustrative par curve and the zero curve bootstrapped from it (Proposition 3.13). Where the par curve rises, the zero curve lies above it, because a coupon bond’s yield averages the zero rates of all its payments, most of them earlier and lower; where the par curve dips, at one to two years, the zero curve dips below it. Data: the chapter’s tutorial.
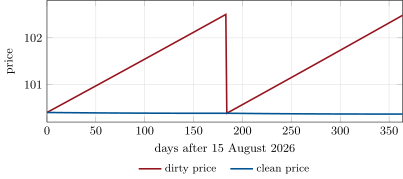
The ten-year note over a year at a constant yield of 4.20%, daily. The dirty price climbs as the coupon accrues and drops by the coupon when it is paid (15 February, day 184); the clean price moves only by its slow pull towards par. Data: the chapter’s tutorial.
Figure 3.4. The ten-year note over a year at a constant yield of 4.20%, daily. The dirty price climbs as the coupon accrues and drops by the coupon when it is paid (15 February, day 184); the clean price moves only by its slow pull towards par. Data: the chapter’s tutorial.
اقرأ في الفصل →