All books

Professional

Apps About Coach Log in Start reading

Quantitative Finance · Glossary

What is Zone map, predicate pushdown, projection pushdown?

Also known as: zone map · predicate pushdown · projection pushdown

Definition 3.6 Research, Data and Risk Platforms · Chapter 3 — Columnar Formats

A zone map is the minimum and maximum of a column within a unit of storage (a row group, a page). Predicate pushdown evaluates a query’s filter against zone maps before reading, and skips every unit whose range cannot satisfy it. Projection pushdown reads only the columns a query names, in its output or its filter.

queryshuffledtime ordersymbol, then time
one symbol, one hour86.0%3.30%3.30%
one symbol, one month34.1%28.2%1.07%
all symbols, one hour81.7%3.13%86.1%
Table 3.2. Share of the file read by three queries (projecting bid and ask) from a month of quotes for fifty symbols in the on-disk columnar format, in three row orders, with row groups of 32 768 rows. Counted by a file object wrapped around the file. Data: pl_colfmt.study.
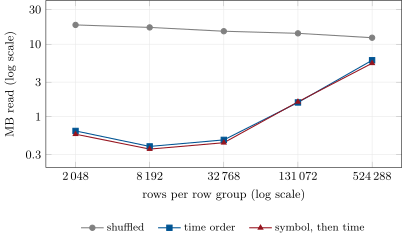
Bytes read by the one-symbol, one-hour query against the size of the row groups, for the three row orders. Sorted, the curve is U-shaped: large groups make zone maps coarse, small ones lengthen the footer every query reads; its minimum here is at 8 192 rows (0.39 MB in time order, 0.36 MB sorted by symbol). Shuffled, only projection helps. Data: pl_colfmt.study.
Figure 3.4. Bytes read by the one-symbol, one-hour query against the size of the row groups, for the three row orders. Sorted, the curve is U-shaped: large groups make zone maps coarse, small ones lengthen the footer every query reads; its minimum here is at 8 192 rows (0.39 MB in time order, 0.36 MB sorted by symbol). Shuffled, only projection helps. Data: pl_colfmt.study.
Read in context →