جميع الكتب

مهني

1 Markets I: The Ecosystem and Exchange-Traded Marketsالأسواق عبر الإنترنت 2 Markets II: Rates, FX and Creditالأسواق عبر الإنترنت 3 Markets III: Commodities, Energy and Cryptoالأسواق عبر الإنترنت 4 Quantitative Methodsالأساليب عبر الإنترنت 5 Derivatives and Volatilityالمشتقات عبر الإنترنت 6 Rates, Credit, XVA and Riskالفائدة والائتمان والمخاطر عبر الإنترنت 7 Research Craft: Predictors, Backtests, Measurement, Portfoliosالبحث عبر الإنترنت 8 Strategies I: Equities and Futuresالاستراتيجيات عبر الإنترنت 9 Strategies II: Volatility, Relative Value, Macro and the Bank Desksالاستراتيجيات عبر الإنترنت 10 Microstructure and Executionالتنفيذ عبر الإنترنت 11 Market Making and High-Frequency Tradingصناعة السوق عبر الإنترنت 12 Machine Learning for Marketsتعلم الآلة عبر الإنترنت 13 Low-Latency Softwareالتكنولوجيا عبر الإنترنت 14 Networks, Hardware and Trading Infrastructureالتكنولوجيا عبر الإنترنت 15 Research, Data and Risk Platformsالتكنولوجيا عبر الإنترنت 16 The Desk and the Firmالشركة عبر الإنترنت 17 The Industry: Firms, Roles and Careersالمسارات المهنية عبر الإنترنت 18 The Interview Bookالمسارات المهنية عبر الإنترنت
التطبيقات حول المدرب تسجيل الدخول ابدأ القراءة

Quantitative Finance · المسرد

ما معنى Zone map, predicate pushdown, projection pushdown؟

يُعرف أيضًا باسم: zone map · predicate pushdown · projection pushdown

Definition 3.6 Research, Data and Risk Platforms · الفصل 3 — Columnar Formats

A zone map is the minimum and maximum of a column within a unit of storage (a row group, a page). Predicate pushdown evaluates a query’s filter against zone maps before reading, and skips every unit whose range cannot satisfy it. Projection pushdown reads only the columns a query names, in its output or its filter.

queryshuffledtime ordersymbol, then time
one symbol, one hour86.0%3.30%3.30%
one symbol, one month34.1%28.2%1.07%
all symbols, one hour81.7%3.13%86.1%
Table 3.2. Share of the file read by three queries (projecting bid and ask) from a month of quotes for fifty symbols in the on-disk columnar format, in three row orders, with row groups of 32 768 rows. Counted by a file object wrapped around the file. Data: pl_colfmt.study.
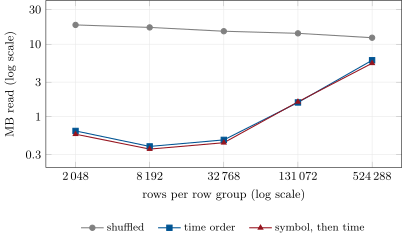
Bytes read by the one-symbol, one-hour query against the size of the row groups, for the three row orders. Sorted, the curve is U-shaped: large groups make zone maps coarse, small ones lengthen the footer every query reads; its minimum here is at 8 192 rows (0.39 MB in time order, 0.36 MB sorted by symbol). Shuffled, only projection helps. Data: pl_colfmt.study.
Figure 3.4. Bytes read by the one-symbol, one-hour query against the size of the row groups, for the three row orders. Sorted, the curve is U-shaped: large groups make zone maps coarse, small ones lengthen the footer every query reads; its minimum here is at 8 192 rows (0.39 MB in time order, 0.36 MB sorted by symbol). Shuffled, only projection helps. Data: pl_colfmt.study.
اقرأ في الفصل →