全部书籍

专业

应用 关于 Coach 登录 开始阅读

书籍暂未推出简体中文版——当前显示英文版。

Earth and Space Sciences · 术语表

什么是 Harker diagram?

Definition 8.4 University Earth and Space Sciences — Year 2 · 第 8 章 — Magmatic Differentiation

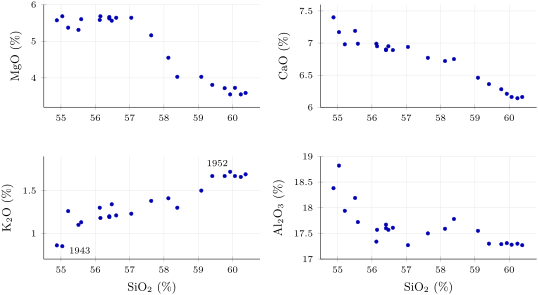
A Harker diagram (silica-variation diagram) plots the mass percentage of each oxide of a suite of related rocks against their mass percentage of SiOX2\ce{SiO2}, one panel per oxide.

Harker diagrams of the 22 lavas of Parícutin analysed by Wilcox (1954), erupted from February 1943 (lowest silica) to February 1952. As silica rises by five per cent, magnesia, lime and alumina fall and potash nearly doubles.
在原文中阅读 →