
All books

Professional

Apps About Coach Log in Start reading

Earth and Space Sciences · Glossary

What is Hjulström diagram?

Definition 20.13 University Earth and Space Sciences — Year 1 · Chapter 20 — Erosion and Transport

A Hjulström diagram plots the mean velocity of a flow against the diameter of the grains, on logarithmic scales, and divides the plane into the fields in which grains at rest are eroded, grains already moving are kept in transport, and moving grains are deposited.
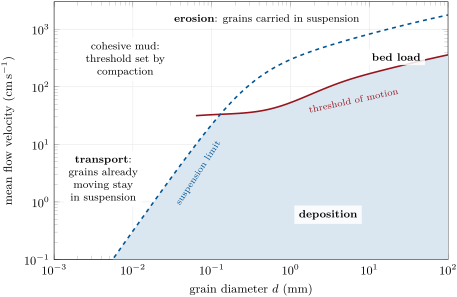
A diagram of the Hjulström type for quartz grains in water 1\, m deep at 20\, C, computed: the threshold of motion (solid) from the curve of Soulsby and Whitehouse, the limit of suspension (dashed) from the combined settling law, both turned into mean velocities by Keulegan’s law. Above the solid curve, grains at rest are eroded; below the lower of the two curves (shaded), moving grains are deposited. Grains finer than 0.13\, mm go into suspension as soon as they move; coarser ones first travel as bed load. The computation holds only for loose grains: the hatched field of cohesive silt and clay is schematic.
A diagram of the Hjulström type for quartz grains in water 1 m1\,\mathrm{m} deep at 20 ∘C20\,{}^{\circ}\mathrm{C}, computed: the threshold of motion (solid) from the curve of Soulsby and Whitehouse, the limit of suspension (dashed) from the combined settling law, both turned into mean velocities by Keulegan’s law. Above the solid curve, grains at rest are eroded; below the lower of the two curves (shaded), moving grains are deposited. Grains finer than 0.13 mm0.13\,\mathrm{mm} go into suspension as soon as they move; coarser ones first travel as bed load. The computation holds only for loose grains: the hatched field of cohesive silt and clay is schematic.
Read in context →