
সব বই

পেশাদার

1 Markets I: The Ecosystem and Exchange-Traded Marketsবাজার অনলাইন 2 Markets II: Rates, FX and Creditবাজার অনলাইন 3 Markets III: Commodities, Energy and Cryptoবাজার অনলাইন 4 Quantitative Methodsপদ্ধতি অনলাইন 5 Derivatives and Volatilityডেরিভেটিভস অনলাইন 6 Rates, Credit, XVA and Riskসুদহার, ঋণ ও ঝুঁকি অনলাইন 7 Research Craft: Predictors, Backtests, Measurement, Portfoliosগবেষণা অনলাইন 8 Strategies I: Equities and Futuresকৌশল অনলাইন 9 Strategies II: Volatility, Relative Value, Macro and the Bank Desksকৌশল অনলাইন 10 Microstructure and Executionএক্সিকিউশন অনলাইন 11 Market Making and High-Frequency Tradingমার্কেট মেকিং অনলাইন 12 Machine Learning for Marketsমেশিন লার্নিং অনলাইন 13 Low-Latency Softwareপ্রযুক্তি অনলাইন 14 Networks, Hardware and Trading Infrastructureপ্রযুক্তি অনলাইন 15 Research, Data and Risk Platformsপ্রযুক্তি অনলাইন 16 The Desk and the Firmপ্রতিষ্ঠান অনলাইন 17 The Industry: Firms, Roles and Careersক্যারিয়ার অনলাইন 18 Interviews I: Maths, Probability and Speedক্যারিয়ার অনলাইন 19 Interviews II: Markets, Trading Games and the Final Roundক্যারিয়ার অনলাইন 20 Interviews III: Codeক্যারিয়ার অনলাইন
অ্যাপ পরিচিতি Coach সাইন ইন পড়া শুরু করো

বইগুলো এখনো বাংলা ভাষায় পাওয়া যায় না — ইংরেজি সংস্করণ দেখানো হচ্ছে।

Earth and Space Sciences · পরিভাষা

Level of free convection; equilibrium level কী?

অন্য নাম: level of free convection · equilibrium level

Definition 21.17 University Earth and Space Sciences — Year 2 · অধ্যায় 21 — Atmospheric Thermodynamics

The level of free convection (LFC) of a lifted parcel is the level above which, saturated, it becomes warmer than its surroundings and rises freely. The equilibrium level (EL) is the level above the LFC where its temperature again equals that of its surroundings.
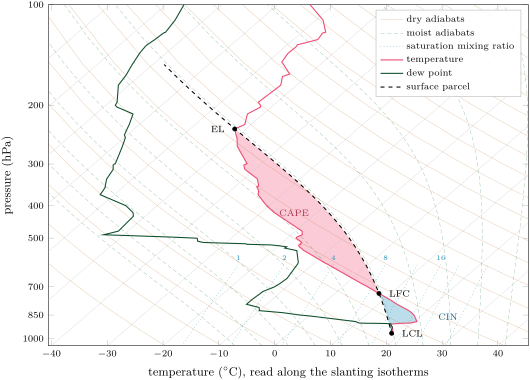
The 12 UTC sounding of Norman, Oklahoma, on 16 April 2026, on a skew-T log-p diagram, with the surface parcel lifted along its dry adiabat to the LCL and its moist adiabat above. Red: the positive area (CAPE); blue: the negative area below the LFC (CIN), both computed with the temperature. Saturation mixing ratios in grams per kilogram, labelled at 600\, hPa.
The 12 UTC sounding of Norman, Oklahoma, on 16 April 2026, on a skew-T log-p diagram, with the surface parcel lifted along its dry adiabat to the LCL and its moist adiabat above. Red: the positive area (CAPE); blue: the negative area below the LFC (CIN), both computed with the temperature. Saturation mixing ratios in grams per kilogram, labelled at 600 hPa600\,\mathrm{hPa}.
প্রসঙ্গসহ পড়ো →