University Earth and Space Sciences — Year 2 · Bachelor Year 2
21Atmospheric Thermodynamics
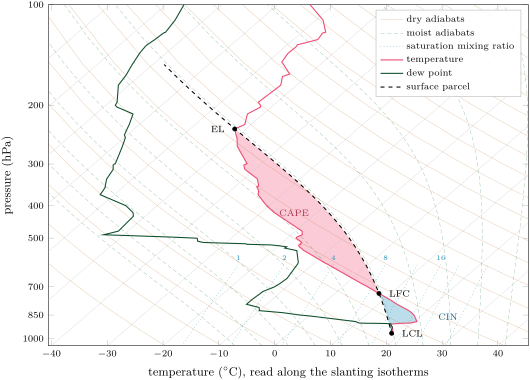
On 16 April 2026, at 12 UTC, a balloon rose from the weather station of Norman, Oklahoma, as balloons rise from more than eight hundred stations at that hour every day. The instrument it carried radioed back a vertical profile that a forecaster reads at a glance: air near the ground almost saturated, a thin warm lid six hundred metres up, and above it a temperature falling fast for ten kilometres. Lifted through the lid, the surface air would have found itself warmer than its surroundings over most of the troposphere, with some two thousand joules per kilogram to spend on rising. This chapter learns to read that energy from a sounding: how much water air holds, how a rising parcel cools before and after it condenses, how the diagrams of meteorologists turn areas into energies, and how cloud droplets form at all.
You already know
From the physics books: saturation vapour pressure, relative humidity, dew point, latent heat, the Clausius–Clapeyron relation and its integrated form; nucleation and supercooling; the first law, adiabatic changes and the heat capacities of an ideal gas. From the chemistry books: partial pressures, Raoult’s law, surface tension and the Kelvin equation. From the school volumes: the condensation level and its rule of per degree, stable and unstable air, the condensation nucleus, the warm-rain and ice-crystal processes. From the Year 1 volume: the standard atmosphere, the environmental and dry adiabatic lapse rates (), the air parcel, the potential temperature, static stability, temperature inversions and the hypsometric equation.
Throughout the chapter: for dry air of molar mass ; for water vapour, of molar mass ; ; (the Year 1 volume, with the ratio of heat capacities 1.4); ; and the latent heat of vaporization at the triple point, .
21.1 Moist air
Air is a mixture of dry air and water vapour, both close to ideal gases. The physics books measure its water by the relative humidity and the dew point; a rising parcel needs measures that do not change when it expands.
Definition 21.1 (Vapour pressure; mixing ratio; specific humidity)
The vapour pressure of moist air is the partial pressure of its water vapour. Its mixing ratio is , the mass of water vapour per unit mass of dry air in the same volume, and its specific humidity is , the mass of vapour per unit mass of moist air. Both are usually given in grams per kilogram.
Proposition 21.2 (Humidity variables)
In moist air at the total pressure with the vapour pressure ,
At saturation, and , the saturation mixing ratio. Neither nor changes when a parcel expands or is compressed without gaining or losing water.
Proof. In the same volume at the temperature , each gas obeys its own ideal-gas law with its partial pressure: and , so , and . Dividing by gives . Expansion changes , and but not the two masses. ∎
Definition 21.3 (Virtual temperature)
The virtual temperature of moist air is the temperature that dry air would need, at the same pressure, to have the same density:
The proof that this temperature does what it says is a line: the density of moist air is , which, with , equals . Water vapour is lighter than dry air, so moist air is less dense than dry air at the same temperature and pressure, as if it were a little warmer.
Example 21.4 (The air at Norman)
At the ground the sounding gives , and a dew point of . The vapour pressure is the saturation vapour pressure at the dew point, (Proposition 21.5 below). Then , , and : this air is as light as dry air two and a half degrees warmer.
21.2 Saturation vapour pressure
Over a flat surface of pure water, the vapour pressure at equilibrium depends only on the temperature. The physics books derive its law, the Clausius–Clapeyron relation, and integrate it with a constant latent heat; for water vapour, .
Proposition 21.5 (Saturation vapour pressure)
With the latent heat held constant, the saturation vapour pressure over water is
where is the triple point of water.
Corollary 21.6 (Seven per cent per kelvin)
The relative rate of increase of the saturation vapour pressure is : per kelvin at , at , at .
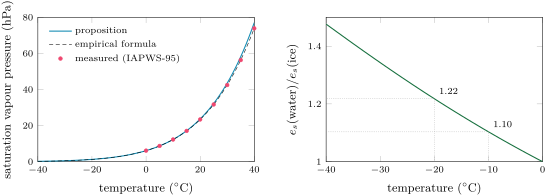
The constant latent heat is the formula’s only flaw: the latent heat falls from at the triple point to at , so the formula runs ahead of the measured values as the temperature rises, by at and at (figure below). An empirical formula fitted to measurements, with in degrees Celsius, stays within a few parts in a thousand; data products use it, but the proposition is the one that can be differentiated and understood, and this chapter keeps it.
Below , water can stay liquid in clouds, supercooled, and two saturation vapour pressures exist: over liquid water and over ice. The second is lower, because the latent heat of sublimation exceeds that of vaporization by the latent heat of fusion. Air saturated with respect to supercooled droplets is supersaturated with respect to ice, by at and at : the last section returns to that difference.
21.3 Rising moist air
A parcel that rises without exchanging heat cools at the dry adiabatic lapse rate, keeps its potential temperature, and, if it does not condense, keeps its mixing ratio. Its vapour pressure falls with the pressure, but its saturation vapour pressure falls faster, with its temperature. The two meet at a level that the school volumes found by a rule.
Definition 21.7 (Lifting condensation level)
The lifting condensation level (LCL) of a parcel is the level at which it becomes saturated when it is lifted dry adiabatically. It is the condensation level of the school volumes, the height of the flat bases of the clouds that form by lifting.
Proposition 21.8 (Height of the lifting condensation level)
A parcel at the temperature with the dew point reaches saturation about
above its starting level: about for each degree of dew-point depression.
Proof. The parcel’s temperature falls at . Its dew point is the temperature at which its vapour pressure would saturate; with constant, is proportional to , so by the hydrostatic balance. By Proposition 21.5, . Hence : the dew point falls too, but more slowly. The gap closes at the rate . With , , and kilometres per kelvin is . ∎
At Norman the dew-point depression was : the surface air would have condensed after of ascent, at . The full computation, which follows the dry adiabat and the saturation mixing ratio without linearizing, gives .
Above the LCL the parcel condenses as it rises. Condensation releases latent heat, and the parcel cools more slowly.
Definition 21.9 (Saturated adiabatic lapse rate; moist adiabat)
The saturated adiabatic lapse rate is the rate at which the temperature of a saturated parcel falls as it rises, its vapour condensing to keep it saturated. The curve it follows on a diagram of temperature against pressure is a moist adiabat. When the condensed water is assumed to fall out at once, the ascent is called pseudo-adiabatic.
Proposition 21.10 (Saturated adiabatic lapse rate)
For a pseudo-adiabatic ascent, with ,
It tends to when tends to zero, and is smaller otherwise.
Proof. Per unit mass of dry air, the first law for a parcel that receives the latent heat of the vapour it condenses, , reads ; with the hydrostatic balance , it becomes . With , . Substituting and collecting the terms in and in gives . ∎
The rate depends on how much water there is to condense. At it is at , at , at and at ; high in the troposphere, at and , it is back to , almost the dry rate. A moist adiabat is therefore steep near warm ground and bends towards the dry adiabats aloft.
Definition 21.11 (Equivalent potential temperature)
The equivalent potential temperature of a parcel is the temperature it would have if it were lifted until all its vapour had condensed and fallen out, then brought down dry adiabatically to . A good approximation is
with the potential temperature and the temperature at the parcel’s lifting condensation level.
The potential temperature is conserved in dry ascent only; is conserved, to this approximation, in dry and saturated ascent alike, because the heat it counts as already released is exactly the heat condensation releases. It labels a moist adiabat as labels a dry one. The Norman surface air has and .
21.4 Thermodynamic diagrams
Definition 21.12 (Atmospheric sounding)
An atmospheric sounding is a vertical profile of the pressure, temperature, humidity and wind of the atmosphere above a place, measured by an instrument carried aloft, usually a radiosonde under a balloon.
A sounding is not quite vertical, because the balloon drifts with the wind, nor quite instantaneous, because it takes several minutes to reach the upper troposphere; and the main network launches only twice a day. Its numbers become useful once they are drawn on a chart where a rising parcel can be followed with a ruler.
Definition 21.13 (Thermodynamic diagram; skew-T log-p diagram; tephigram)
A thermodynamic diagram is a chart whose coordinates are functions of the pressure and the temperature, on which isobars, isotherms, dry adiabats, moist adiabats and lines of constant saturation mixing ratio are printed, and on which a sounding is plotted as two curves, its temperature and its dew point. On a skew-T log-p diagram the vertical coordinate is and the horizontal one is , so that isobars are horizontal and isotherms are straight lines slanting up to the right. A tephigram uses the temperature and the entropy per unit mass as coordinates, so that isotherms and dry adiabats are perpendicular straight lines.
Proposition 21.14 (Areas are energies)
On a skew-T log-p diagram, the area enclosed between two curves and over the pressures is proportional to , the energy per unit mass that Proposition 21.19 below gives to a parcel following through an environment .
Proof. Take and . The Jacobian of is 1, so areas in the plane equal areas in the plane, where the area between two curves is taken from to with the sign fixed. Multiplying by and by the scale of the chart gives the energy. ∎
Method 21.15 (Lifting a parcel on a diagram)
- Plot the sounding’s temperature and dew point against pressure.
- From the parcel’s temperature, follow the dry adiabat upward; from its dew point, follow the line of saturation mixing ratio. Where they meet is the LCL.
- From the LCL, follow the moist adiabat upward.
- Where the parcel’s curve lies to the right of the sounding’s temperature, the parcel is warmer than its surroundings; the levels where the two curves cross are the levels of Definition 21.17 below.
21.5 Stability and convective energy
The Year 1 volume compared the lapse rate of a layer with . A saturated parcel cools at instead, and a third case appears between the two rates.
Definition 21.16 (Conditional instability)
A layer whose lapse rate lies between the saturated and the dry adiabatic lapse rates, , is in conditional instability: stable for unsaturated parcels, unstable for saturated ones.
At Norman the temperature fell by between () and (), at : conditional instability over four kilometres. Whether the instability is released depends on where a parcel from below becomes saturated and then warmer than its surroundings.
Definition 21.17 (Level of free convection; equilibrium level)
The level of free convection (LFC) of a lifted parcel is the level above which, saturated, it becomes warmer than its surroundings and rises freely. The equilibrium level (EL) is the level above the LFC where its temperature again equals that of its surroundings.
Definition 21.18 (Convective available potential energy; convective inhibition)
The convective available potential energy (CAPE) of a parcel is the work of the buoyancy force on unit mass of it between its LFC and its EL,
and its convective inhibition (CIN) is the same integral, negative, from its starting level to its LFC.
Proposition 21.19 (Buoyancy on a diagram; the parcel’s speed)
- In terms of pressure, : on a skew-T log-p diagram, it is proportional to the area between the parcel’s curve and the sounding.
- A parcel that leaves the LFC at rest and keeps all the work of its buoyancy reaches the EL with the vertical speed .
Proof. 1. The parcel and its surroundings share the pressure, so the density ratio is the ratio of the virtual temperatures and the buoyancy force per unit mass is . The environment is hydrostatic: . Substituting cancels and ; the area follows from Proposition 21.14. 2. With the buoyancy force per unit mass, and give ; integrating from the LFC, where , to the EL gives . ∎
Example 21.20 (The energy in the Norman sounding)
Lift the surface air of Example 21.4. It saturates at , up, and follows a moist adiabat. Below the sounding is itself nearly saturated and the parcel stays a few tenths of a degree colder than its surroundings; then comes the inversion between and , where the temperature rises by in and the parcel finds itself too cold. It becomes warmer than its surroundings only at , above the ground, its LFC, and stays warmer up to its EL at , above sea level, just below the tropopause the sounding reports at . On a fine grid of pressures the areas of the skew-T figure are CAPE and CIN with the temperature, and and with the virtual temperature: the moisture of the parcel adds its own buoyancy. Parcel theory gives .
Forecasters’ tables call a CAPE up to positive, one between 1500 and large and one above extreme; values above are common in thunderstorm environments, and rare ones exceed . CAPE is largest in the warm season, especially in late spring. The lifted index, the sounding’s temperature at minus that of the lifted parcel, sums the same information in one number: at Norman, , in the class from to that the forecasters’ tables call extreme instability. None of these values is a threshold above which storms must form.
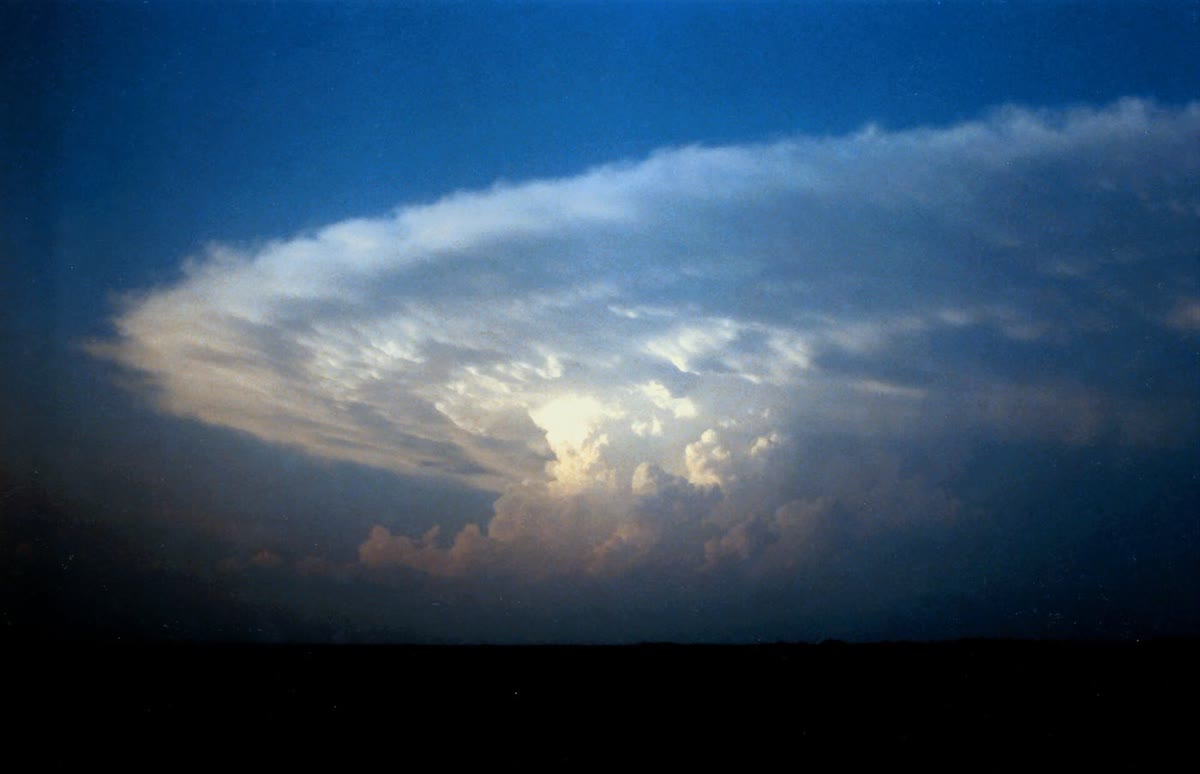
The CIN is the price of admission. The warm lid kept the surface air from rising on its own: a parcel would have to be pushed through it, by a front or by the slow ascent of the air ahead of a disturbance aloft, or warmed from below by the afternoon sun until it was buoyant all the way. And the speed is an upper bound: a real updraft carries its condensed water, which weighs it down, and mixes with the drier air around it, which cools it by evaporation. The equilibrium level remains a good guide to where the storm tops spread out into an anvil.
21.6 Cloud microphysics
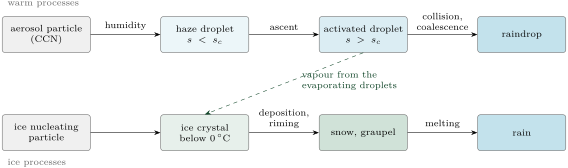
A parcel at its LCL is saturated over a flat water surface. A droplet is not flat: the physics books show that a new phase does not appear at equilibrium, but only through nucleation, and the chemistry books that the vapour pressure over a curved surface exceeds that over a flat one (the Kelvin equation). With the constant of Proposition 21.22 below, a droplet of pure water across is in equilibrium only at the saturation ratio , a supersaturation of , far above the fractions of a per cent at which particles activate: droplets form on particles.
Definition 21.21 (Supersaturation; cloud condensation nucleus)
The supersaturation of air is , the excess of its vapour pressure over the saturation vapour pressure above a flat surface of pure water, usually given in per cent. A cloud condensation nucleus (CCN) is an aerosol particle on which a cloud droplet forms at the small supersaturations of clouds. It is the condensation nucleus of the school volumes.
Proposition 21.22 (Köhler curve)
A solution droplet of diameter grown on a dry particle of diameter and hygroscopicity is in equilibrium with the saturation ratio
with the surface tension and the density of water (admitted). The curve is the Köhler curve. For ,
which is maximal at the critical diameter and supersaturation
Proof of the approximation. The exponential is the Kelvin factor; the fraction is the water activity, a version of Raoult’s law in which measures how much water the dissolved matter binds. For and , and the fraction is to first order; the product, to first order, is . Setting the derivative to zero gives , and then , which is the formula. ∎
With at , . Ammonium sulfate has ; sodium chloride is more hygroscopic still (), and atmospheric particles mostly lie between 0.1 and 0.9. A dry particle of of ammonium sulfate has and ; one of , and . The approximation differs from the exact maximum by less than .
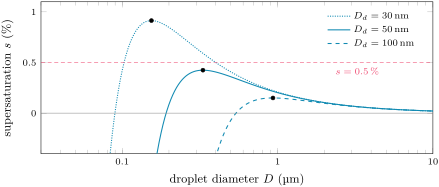
The curve divides the particles. Below its peak a droplet is in stable equilibrium: if it grows, the air is no longer supersaturated enough for it and it shrinks back; such haze droplets swell and shrink with the humidity. Once the supersaturation of the air exceeds , the droplet is activated: past the peak, it needs less and less supersaturation as it grows, and it grows for as long as there is vapour. A rising parcel cools, its supersaturation climbs, and the largest and most soluble particles activate first; the droplets they make then take up the vapour and cap the supersaturation. Over remote oceans there are about 110 CCN per cubic centimetre active at , over remote continents almost twice as many, and in polluted air about ten times more. The same water shared among more droplets makes them smaller.
Remark 21.23 (Why condensation alone does not make rain)
A droplet grows by the diffusion of vapour towards it. The flux through a sphere around a droplet of radius is , with the diffusivity of vapour and the excess of vapour density far away, so its mass grows at a rate proportional to : is constant and grows linearly in time. Large droplets grow more slowly than small ones, and a population growing by condensation alone becomes narrower, not broader. Raindrops form when droplets of different sizes, falling at different speeds, collide and coalesce.
Above the level a cloud is made of supercooled droplets until ice nucleating particles start ice crystals. Then the difference of the right panel of the saturation figure acts: air saturated over the droplets is supersaturated over ice at , tens of times the supersaturations at which the droplets activated. The crystals grow by deposition at the expense of the droplets, which evaporate (the Bergeron process, the ice-crystal process of the school volumes), and they collect droplets that freeze on them (riming).
In the field — A morning launch
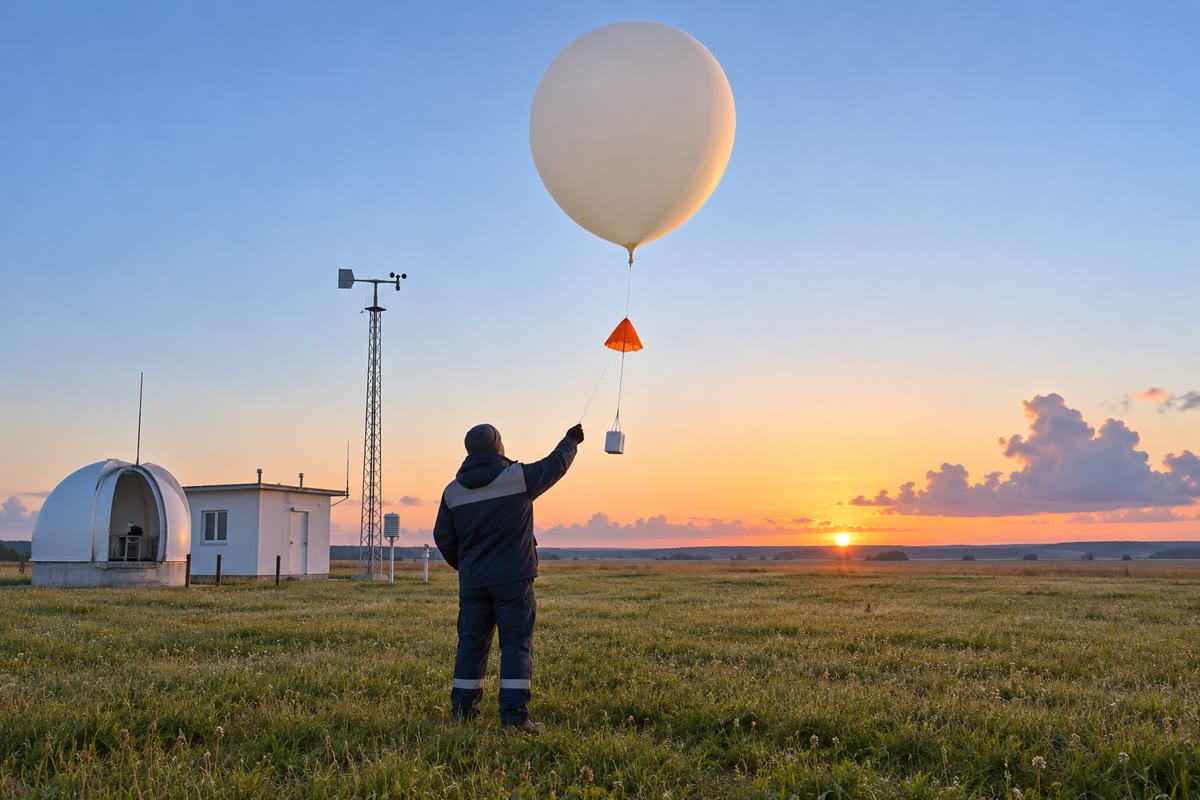
At each upper-air station the technician prepares the balloon and the radiosonde in the hour before 00 and 12 UTC, the times at which more than eight hundred stations of the world observe together. The instrument, of 60 to , hangs below the balloon and reports the pressure, the temperature, the humidity and its satellite position every second. The balloon rises about a minute, for two hours or more, past before it bursts, and may drift more than . Forecasters plot the profile on a skew-T diagram, and on days when severe weather is expected some stations launch extra balloons.
Exercises
Data for the exercises, unless stated otherwise: ; , , , , , , .
Exercise 21.1 ★
At the temperature is and the dew point . (a) Find the vapour pressure and the saturation vapour pressure. (b) Find the relative humidity. (c) Find the mixing ratio and the specific humidity, in grams per kilogram.
Solution
Solution of Exercise 21.1.
(a) and . (b) . (c) and .
Exercise 21.2 ★
(a) By how many per cent per kelvin does rise at , and ? (b) Compute at and at , and their ratio; compare with . (c) The measured value at is . By how much does the formula err, and in which direction? Why?
Solution
Solution of Exercise 21.2.
(a) : per kelvin at , at , at . (b) and ; ratio 1.363, against . The rate is a derivative of , so over the factor is , with 0.0620 the rate at the mid-point ; compounding five times is close but not exact. (c) : the formula is too high, because it keeps the latent heat of the triple point, while the latent heat decreases as the temperature rises; the formula’s slope is too steep, and its error grows with the distance from .
Exercise 21.3 ★
At noon the surface air is at with a dew point of . (a) At what height above the ground do cumulus bases form? (b) What is the temperature of a parcel there, by the dry adiabat? (c) What is its dew point there, with ? Comment. (d) Later the air warms to , the dew point unchanged. Where are the cloud bases now?
Solution
Solution of Exercise 21.3.
(a) . (b) . (c) : temperature and dew point meet, as they must at the level of saturation; the rule is this calculation. (d) : the bases rise as the afternoon warms the ground air.
Exercise 21.4 ★
Read the skew-T diagram of the Norman sounding. (a) Up to which pressure is the air near the ground saturated, or nearly so? (b) Where is the inversion, and how does it show? (c) Read the LCL, the LFC and the EL of the surface parcel. (d) How do the dew point and the temperature compare just above the inversion, and what does that say about this air?
Solution
Solution of Exercise 21.4.
(a) The dew-point curve lies on the temperature curve from the ground to about : the lowest half-kilometre is saturated, or nearly. (b) Between about 908 and the temperature curve turns to the right, to warmer values, as the pressure decreases: the temperature rises with height. (c) LCL at about , a few tens of metres up; LFC at about ; EL at about . (d) At the top of the inversion the dew point is below the temperature, and below it at : warm, very dry air lies on top of cool, moist air. Its relative humidity is low, so it did not acquire its warmth by condensation; air that sinks warms by compression at the dry adiabatic rate while keeping its mixing ratio, which would give such a layer.
Exercise 21.5 ★★
Tropical air at has and . (a) Find its virtual temperature exactly and with the approximation . (b) Find the densities of this air and of dry air at the same temperature and pressure. (c) By how much would dry air have to be warmed to be as light? (d) Why does this matter for convection over warm seas?
Solution
Solution of Exercise 21.5.
(a) ; the approximation gives . (b) , against for dry air: lighter. (c) By . (d) A rising parcel needs only to be lighter than its surroundings: over warm seas the moisture of the air adds a buoyancy equivalent to several kelvin, as much as a sizable excess of temperature.
Exercise 21.6 ★★
Use Proposition 21.10 at , with from Proposition 21.2. (a) Compute and at , and . (b) How much warmer than a dry parcel is a saturated parcel at after rising , if its lapse rate stays the same? (c) Why does the difference shrink higher up?
Solution
Solution of Exercise 21.6.
(a) = 6.11, 23.66 and ; = 3.82, 15.07 and ; = 6.48, 4.20 and . (b) The dry parcel cools by , the saturated one by : the saturated parcel is warmer. (c) Higher up the air is colder, is smaller, little vapour is left to condense, and returns towards .
Exercise 21.7 ★★
The Norman surface parcel (, , ) has its LCL at . (a) Compute its mixing ratio, its potential temperature and its equivalent potential temperature. (b) Lifted, it is at at , saturated. Compute its and there. (c) Which of the two is conserved?
Solution
Solution of Exercise 21.7.
(a) , ; ; . (b) , ; ; the parcel is saturated, so and . (c) rose by , warmed by the latent heat of the of vapour that condensed; changed by , within the accuracy of its approximate formula: it is conserved.
Exercise 21.8 ★★
A parcel is warmer than its surroundings by between , its LFC, and , its EL; ignore the virtual-temperature correction. (a) Compute its CAPE. (b) Compute . (c) Which class does the CAPE fall into? (d) On a skew-T diagram, what shape has the positive area, and why is its area what was computed?
Solution
Solution of Exercise 21.8.
(a) . (b) . (c) Between 1 and : positive, but not large. (d) A band of constant horizontal width between two curves; by Proposition 21.14 its area is proportional to , whatever the slant of the isotherms.
Exercise 21.9 ★★
Take and ammonium sulfate, . (a) Find the critical diameter and supersaturation of a dry particle of . (b) What is the smallest dry particle activated in air at supersaturation? At ? (c) An updraft raises the supersaturation from to : what happens to the number of droplets, and to their size for the same liquid water?
Solution
Solution of Exercise 21.9.
(a) ; . (b) Solving for : , at and at . (c) Every particle between 63 and now activates as well: more droplets, and, for the same liquid water, smaller ones.
Exercise 21.10 ★★★
The Norman surface parcel had a CIN of about with the virtual temperature. (a) With what vertical speed would it have to leave the ground to reach its LFC by its own momentum? (b) The inversion top is at and . To what temperature must the surface air at warm for a parcel lifted dry adiabatically to be no colder than the inversion top? (c) If its dew point stayed at , where would its cloud base be? (d) Name two ways in which the atmosphere removes such a lid without the sun.
Solution
Solution of Exercise 21.10.
(a) , impossible for air at rest near the ground. (b) The potential temperature of the inversion top is ; a surface parcel with this has , . (c) above the ground, above the old inversion top. (d) A front, which lifts the air on its slope; the slow ascent of the air ahead of a disturbance aloft, which cools the lid itself.
Exercise 21.11 ★★★
(a) Show from Proposition 21.10 that as . (b) Show that when , , and evaluate it at . (c) Compare with of Proposition 21.8 when , and explain why the two limits coincide. (d) Is the limit of (b) reached in the atmosphere? Use the value at and .
Solution
Solution of Exercise 21.11.
(a) When , the numerator tends to and the denominator to . (b) Write , with at : when , also , and . (c) With , , the same. In that limit the latent heat is so large that the parcel can condense almost none of its vapour without warming far above its saturation point: it keeps its mixing ratio and follows the line of constant mixing ratio, along which the temperature falls at . (d) At and , , not much greater than 1, and , four times : , still far from . The limit is not reached.
Exercise 21.12 ★★★
Over supercooled water and over ice the saturation vapour pressures are 2.868 and at , 1.257 and at . (a) Find the supersaturation over ice of air saturated over water at both temperatures. (b) Compare with the supersaturations at which droplets activate. (c) Explain why a cloud of supercooled droplets that receives a few ice crystals turns to ice. (d) Why is the effect weaker near ?
Solution
Solution of Exercise 21.12.
(a) and : and . (b) Droplets activate at a few tenths of a per cent of supersaturation, tens of times less. (c) The crystals grow fast by deposition; they take vapour from the air, which falls below saturation over the droplets; the droplets evaporate and their vapour goes to the ice (the Bergeron process), until the cloud is glaciated. (d) At the two saturation vapour pressures are equal: they meet at the triple point, and the ratio tends to one near it.
Problem 21.1
Weekend problem — Reading the morning sounding
The table gives the 12 UTC sounding of Norman, Oklahoma, on 16 April 2026, at the levels used here: pressure, height above sea level, temperature, dew point, and the temperature of the surface parcel lifted as in Method 21.15, computed by integrating Proposition 21.10 in small steps. The sounding reports the tropopause at and . Use the data of the exercises and the temperatures (not the virtual temperatures) unless told otherwise.
| () | () | () | () | () |
|---|---|---|---|---|
| 971.1 | 345 | 19.0 | 18.5 | 19.0 |
| 925.0 | 763 | 17.3 | 17.3 | 16.9 |
| 907.7 | 924 | 16.4 | 16.4 | 16.2 |
| 889.1 | 1102 | 20.5 | 9.5 | 15.4 |
| 850.0 | 1489 | 18.6 | 13.7 | |
| 700.0 | 3110 | 4.5 | 6.1 | |
| 500.0 | 5725 | |||
| 400.0 | 7357 | |||
| 300.0 | 9349 | |||
| 250.0 | 10560 | |||
| 200.0 | 12006 |
Part I — The air near the ground.
- Find the vapour pressure of the surface air, to one decimal.
- Find its mixing ratio, to one decimal.
- Find its specific humidity.
- Find its relative humidity.
- By how much does its virtual temperature exceed its temperature?
- Find the height of its LCL above the ground with the rule, and the pressure there (take a mean virtual temperature of for the layer).
- Find its potential temperature.
Part II — The lid and the layers above.
- At , is the parcel warmer or colder than its surroundings, and by how much?
- Find the lapse rate between 907.7 and . What kind of layer is this?
- By how much is the parcel colder than its surroundings at ?
- Find the relative humidity at . Where could such air have come from?
- Find the mean lapse rate between 850 and and classify the layer.
- Find the lifted index and its class.
Part III — The energy.
- Compute the excess at each level of the table.
- Find the LFC by interpolating linearly in , to the nearest hectopascal, and its height by interpolating the same way.
- Find the EL and its height in the same way. Compare with the tropopause.
- Compute the CAPE by the trapezium rule in , from the LFC to the EL through the levels of the table.
- Which class does it fall into?
- Compute the CIN in the same way, from the ground to the LFC.
- A computation on a grid of gives a CAPE of with the temperatures and with the virtual temperatures. Why do the three values differ?
Part IV — The storm the air could feed.
- What vertical speed does parcel theory give with the CAPE of question 17?
- At half that speed throughout, how long would the air take to rise from the LFC to the EL?
- Name two effects that make a real updraft slower.
- To sum up: what updraft speed does parcel theory predict for a storm fed by this morning’s surface air?
Solution
Solution of Problem 21.1.
1. . 2. . 3. . 4. ; . 5. . 6. ; . 7. . 8. : colder. 9. : the temperature rises by , a lapse rate of . An inversion: absolutely stable, a lid. 10. . 11. and : . Warm and dry, it can be air that sank and warmed by compression, or air heated over dry ground upwind; it is not the moist air below. 12. over , : between and , conditionally unstable. 13. : extreme instability ( to ). 14. From the ground up: 0, , , , , , , , , , . 15. Between 850 () and (), at the fraction : , ; , above the ground. 16. Between 250 () and (), at the fraction : and , about below the reported tropopause (). 17. The segments (mean times of the pressure ratio): ; ; ; ; ; ; sum . , to three figures. 18. Between 1500 and : large. 19. ; . 20. The table keeps only eleven levels: between them the trapezium rule replaces the curves by straight segments in and misses their bends. The grid follows the curves. The virtual temperature adds the buoyancy of the parcel’s water vapour, more abundant in the saturated parcel than in the dry air around it: a larger CAPE, a smaller CIN. 21. . 22. at : , about four minutes. 23. The weight of the condensed water the updraft carries; the mixing in of drier air around it (entrainment), which cools it as droplets evaporate. 24. Parcel theory gives the updraft of a storm fed by this air a speed of about , an upper bound.
Terms defined in this chapter
- Atmospheric sounding
- Conditional instability
- Convective available potential energy; convective inhibition
- Equivalent potential temperature
- Level of free convection; equilibrium level
- Lifting condensation level
- Saturated adiabatic lapse rate; moist adiabat
- Supersaturation; cloud condensation nucleus
- Thermodynamic diagram; skew-T log-p diagram; tephigram
- Vapour pressure; mixing ratio; specific humidity
- Virtual temperature