All books

Professional

Apps About Coach Log in Start reading

Earth and Space Sciences · Glossary

What is Radar interferometry; interferogram; line of sight?

Also known as: radar interferometry · interferogram · line of sight (radar) · phase unwrapping

Definition 25.13 University Earth and Space Sciences — Year 3 · Chapter 25 — Remote Sensing and GIS

Radar interferometry (InSAR) combines two radar images of the same ground, taken from nearly the same position at two times, pixel by pixel. Their interferogram is the map of the difference of their phases, known modulo 2π2\pi and drawn as a cycle of colours, one cycle a fringe. The line of sight is the direction from the ground to the antenna; the radar measures only the component of a displacement along it. Phase unwrapping is the reconstruction of the continuous phase from the wrapped one, by adding to each pixel the multiple of 2π2\pi that makes the phase vary smoothly from its neighbours.
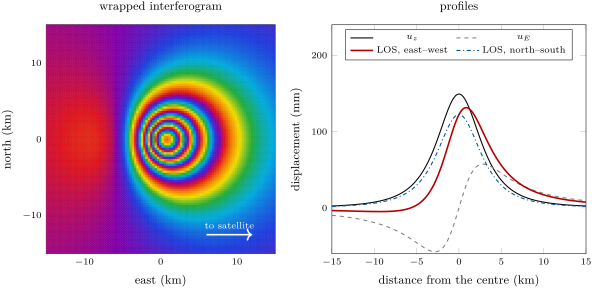
A Mogi source at 4\, km depth that grows by 107\, m3 (= 0.25), seen in the C band of Sentinel-1 at an incidence of 35 from a satellite to the east. Left, the wrapped phase: each cycle of colours is 27.7\, mm of motion towards the satellite, four and a half cycles from the edge to the centre. Right, the vertical and eastward displacement along the east–west line through the centre, and the change of the line of sight along that line and along the north–south line: the outward motion towards the satellite adds to the uplift on the east side and subtracts on the west.
A Mogi source at 4 km4\,\mathrm{km} depth that grows by 107 m310^{7}\,\mathrm{m}^{3} (ν=0.25\nu = 0.25), seen in the C band of Sentinel-1 at an incidence of 35∘35{}^{\circ} from a satellite to the east. Left, the wrapped phase: each cycle of colours is 27.7 mm27.7\,\mathrm{mm} of motion towards the satellite, four and a half cycles from the edge to the centre. Right, the vertical and eastward displacement along the east–west line through the centre, and the change of the line of sight along that line and along the north–south line: the outward motion towards the satellite adds to the uplift on the east side and subtracts on the west.
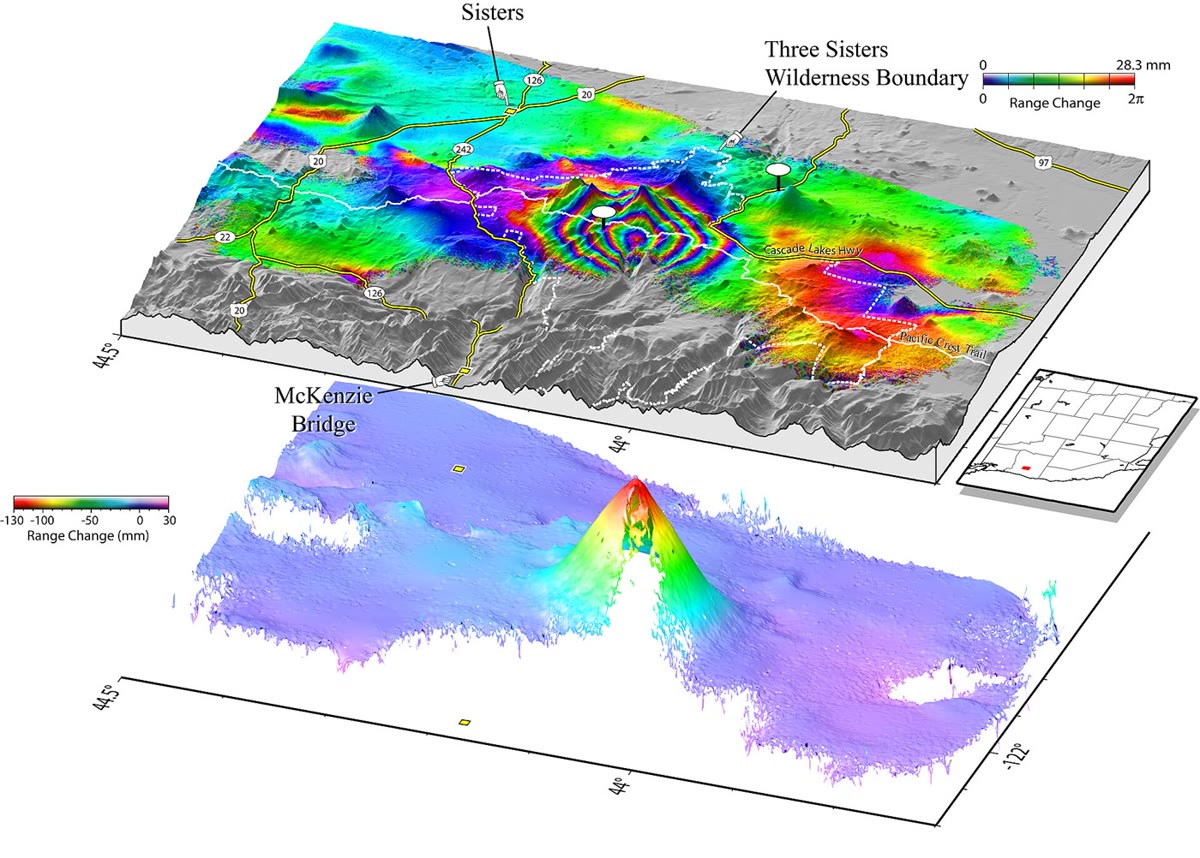
Above, the interferogram of the Three Sisters volcanic centre, Oregon, 1995–2001, draped over the relief: each cycle of colours is 28.3\, mm of range change, and the bull’s eye of rings at the centre marks the uplift. Below, the same data unwrapped and drawn as a relief: the range shortens by up to 130\, mm at the centre. U.S. Geological Survey (Wicks and others, 2002), public domain.
Above, the interferogram of the Three Sisters volcanic centre, Oregon, 1995–2001, draped over the relief: each cycle of colours is 28.3 mm28.3\,\mathrm{mm} of range change, and the bull’s eye of rings at the centre marks the uplift. Below, the same data unwrapped and drawn as a relief: the range shortens by up to 130 mm130\,\mathrm{mm} at the centre. U.S. Geological Survey (Wicks and others, 2002), public domain.
Read in context →