
全部书籍

专业

应用 关于 Coach 登录 开始阅读

书籍暂未推出简体中文版——当前显示英文版。

Earth and Space Sciences · 术语表

什么是 Ratio–ratio diagram?

又称: ratio--ratio diagram

Definition 12.10 University Earth and Space Sciences — Year 3 · 第 12 章 — Trace-Element Modelling

A ratio–ratio diagram plots, for a suite of lavas, the ratio of a highly incompatible element HH to a less incompatible one MM against the concentration of HH (or against another ratio). Partial melting, crystallisation and mixing draw lines of different shapes on it.
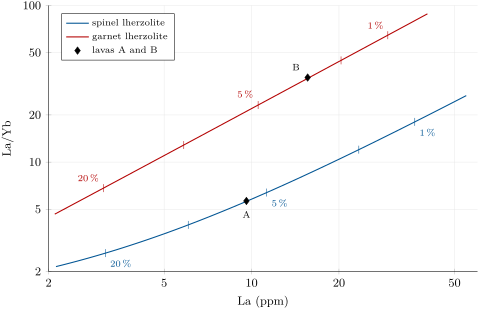
Batch melts of a primitive-mantle source on a La/Yb against La diagram, for a spinel and a garnet lherzolite, with ticks at F = 1, 2, 5, 10 and 20\,\%, and the two invented lavas of the weekend problem. Each lava sits on one curve only.
Batch melts of a primitive-mantle source on a La/Yb against La diagram, for a spinel and a garnet lherzolite, with ticks at F=1F = 1, 2, 5, 10 and 20 %20\,\%, and the two invented lavas of the weekend problem. Each lava sits on one curve only.
在原文中阅读 →