جميع الكتب

مهني

1 Markets I: The Ecosystem and Exchange-Traded Marketsالأسواق عبر الإنترنت 2 Markets II: Rates, FX and Creditالأسواق عبر الإنترنت 3 Markets III: Commodities, Energy and Cryptoالأسواق عبر الإنترنت 4 Quantitative Methodsالأساليب عبر الإنترنت 5 Derivatives and Volatilityالمشتقات عبر الإنترنت 6 Rates, Credit, XVA and Riskالفائدة والائتمان والمخاطر عبر الإنترنت 7 Research Craft: Predictors, Backtests, Measurement, Portfoliosالبحث عبر الإنترنت 8 Strategies I: Equities and Futuresالاستراتيجيات عبر الإنترنت 9 Strategies II: Volatility, Relative Value, Macro and the Bank Desksالاستراتيجيات عبر الإنترنت 10 Microstructure and Executionالتنفيذ عبر الإنترنت 11 Market Making and High-Frequency Tradingصناعة السوق عبر الإنترنت 12 Machine Learning for Marketsتعلم الآلة عبر الإنترنت 13 Low-Latency Softwareالتكنولوجيا عبر الإنترنت 14 Networks, Hardware and Trading Infrastructureالتكنولوجيا عبر الإنترنت 15 Research, Data and Risk Platformsالتكنولوجيا عبر الإنترنت 16 The Desk and the Firmالشركة عبر الإنترنت 17 The Industry: Firms, Roles and Careersالمسارات المهنية عبر الإنترنت 18 The Interview Bookالمسارات المهنية عبر الإنترنت
التطبيقات حول المدرب تسجيل الدخول ابدأ القراءة

Quantitative Finance · المسرد

ما معنى Coherent risk measure؟

Definition 21.12 Rates, Credit, XVA and Risk · الفصل 21 — Market-Risk Measures

A risk measure ρ\rho is a coherent risk measure if it is monotone, translation invariant (ρ(L+c)=ρ(L)+c\rho(L+c) = \rho(L)+c), positively homogeneous (ρ(λL)=λρ(L)\rho(\lambda L) = \lambda\rho(L) for λ≥0\lambda\ge0) and subadditive (ρ(L1+L2)≤ρ(L1)+ρ(L2)\rho(L_1+L_2)\le\rho(L_1)+\rho(L_2)). Expected shortfall is coherent; VaR is not subadditive in general.
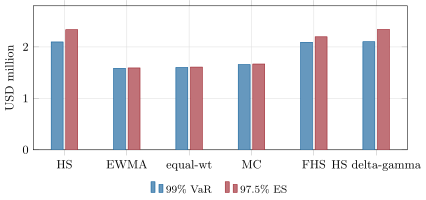
One-day 99% VaR and 97.5% ES of the book on 23 September 2026 by method. Normal methods agree with each other and give lower numbers; historical and filtered historical simulation see the fat tails, and their ES exceeds their VaR. Data: US Treasury par yields, ECB reference rates; the chapter’s tutorial.
Figure 21.1. One-day 99% VaR and 97.5% ES of the book on 23 September 2026 by method. Normal methods agree with each other and give lower numbers; historical and filtered historical simulation see the fat tails, and their ES exceeds their VaR. Data: US Treasury par yields, ECB reference rates; the chapter’s tutorial.
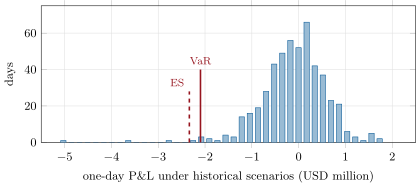
Distribution of the book’s P&L over the last 500 historical days applied to today’s positions, with the 99% VaR and the 97.5% ES. Data: US Treasury, ECB; the chapter’s tutorial.
Figure 21.2. Distribution of the book’s P&L over the last 500 historical days applied to today’s positions, with the 99% VaR and the 97.5% ES. Data: US Treasury, ECB; the chapter’s tutorial.

أمثلة

Example 21.13 (Two concentrated bonds)

Each of two bonds defaults independently with probability 0.9%, losing 100. Each alone has a 99% VaR of zero; together, the probability of at least one default is 1.79%, so the 99% VaR is 100: diversifying raised VaR. Expected shortfall at 99% is 90 for each bond and 100.8 for the pair, less than their sum of 180.

اقرأ في الفصل →