
جميع الكتب

مهني

1 Markets I: The Ecosystem and Exchange-Traded Marketsالأسواق عبر الإنترنت 2 Markets II: Rates, FX and Creditالأسواق عبر الإنترنت 3 Markets III: Commodities, Energy and Cryptoالأسواق عبر الإنترنت 4 Quantitative Methodsالأساليب عبر الإنترنت 5 Derivatives and Volatilityالمشتقات عبر الإنترنت 6 Rates, Credit, XVA and Riskالفائدة والائتمان والمخاطر عبر الإنترنت 7 Research Craft: Predictors, Backtests, Measurement, Portfoliosالبحث عبر الإنترنت 8 Strategies I: Equities and Futuresالاستراتيجيات عبر الإنترنت 9 Strategies II: Volatility, Relative Value, Macro and the Bank Desksالاستراتيجيات عبر الإنترنت 10 Microstructure and Executionالتنفيذ عبر الإنترنت 11 Market Making and High-Frequency Tradingصناعة السوق عبر الإنترنت 12 Machine Learning for Marketsتعلم الآلة عبر الإنترنت 13 Low-Latency Softwareالتكنولوجيا عبر الإنترنت 14 Networks, Hardware and Trading Infrastructureالتكنولوجيا عبر الإنترنت 15 Research, Data and Risk Platformsالتكنولوجيا عبر الإنترنت 16 The Desk and the Firmالشركة عبر الإنترنت 17 The Industry: Firms, Roles and Careersالمسارات المهنية عبر الإنترنت 18 The Interview Bookالمسارات المهنية عبر الإنترنت
التطبيقات حول المدرب تسجيل الدخول ابدأ القراءة

Quantitative Finance · المسرد

ما معنى Conformal prediction؟

Definition 11.6 Machine Learning for Markets · الفصل 11 — Probabilistic Models and Uncertainty

Conformal prediction turns any forecast into prediction sets with a coverage guarantee: a score si=s(xi,yi)s_i = s(x_i, y_i) (for example ∣yi−y^i∣|y_i - \hat y_i|, or that divided by a predicted standard deviation) is computed on nn calibration examples, and the set for a new xx is {y:s(x,y)≤q^}\{y: s(x, y)\le\hat q\} with q^\hat q the ⌈(n+1)(1−α)⌉\lceil(n+1)(1 - \alpha)\rceil-th smallest calibration score (split conformal; Vovk, Gammerman and Shafer, 2005). The adaptive version updates the level online, αt+1=αt+γ(α−errt)\alpha_{t+1} = \alpha_t + \gamma(\alpha - \mathrm{err}_t), to keep the long-run error rate at α\alpha when the data drift (Gibbs and Candès, 2021).
Coverage of 90% intervals on the test days, before and after the volatility regime (dashed: the nominal 90%). The three models’ own intervals, and conformal intervals around the boosted mean forecast: split conformal with raw errors, with errors normalised by the ensemble’s standard deviation, and adaptive. Data: ml_uncert.scores and ml_uncert.conformal.
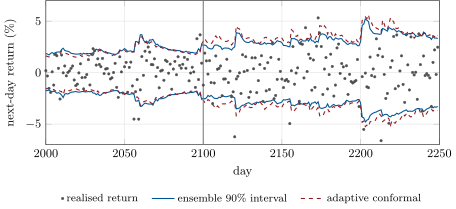
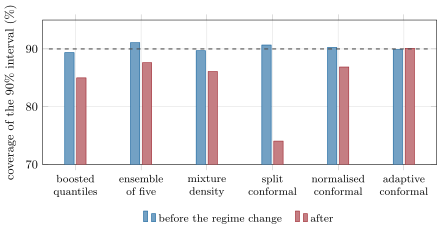
Figure 11.1. Coverage of 90% intervals on the test days, before and after the volatility regime (dashed: the nominal 90%). The three models’ own intervals, and conformal intervals around the boosted mean forecast: split conformal with raw errors, with errors normalised by the ensemble’s standard deviation, and adaptive. Data: ml_uncert.scores and ml_uncert.conformal.
One asset through the regime change at day 2 100 (vertical line): realised next-day returns, the ensemble’s 90% interval, and the adaptive conformal interval around the boosted mean. Both widen after the break; the conformal band widens further as its errors accumulate. Data: ml_uncert.conformal.
Figure 11.2. One asset through the regime change at day 2 100 (vertical line): realised next-day returns, the ensemble’s 90% interval, and the adaptive conformal interval around the boosted mean. Both widen after the break; the conformal band widens further as its errors accumulate. Data: ml_uncert.conformal.
اقرأ في الفصل →