
Alle boeken

Professioneel

Apps Over Coach Inloggen Begin met lezen

Quantitative Finance · Begrippenlijst

Wat is Coordinated omission?

Definition 5.6 Low-Latency Software · Hoofdstuk 5 — Measuring Latency

Coordinated omission is the loss of the slowest measurements when a load generator waits for each response before sending the next request: while the system stalls, the generator sends nothing, so the requests that would have waited during the stall are never issued and never measured.
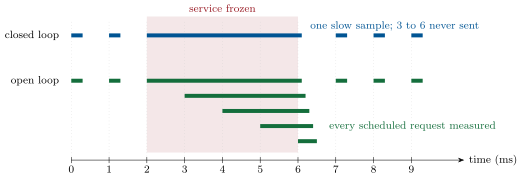
Coordinated omission. Each bar runs from a request’s intended send time to its reply. The closed-loop tester (top) sends at 2, waits through the freeze, and records a single slow sample; the requests due at 3, 4, 5 and 6 are never issued. The open-loop tester (bottom) sends on schedule and measures each request from its intended send time, so every request that waited is counted.
Figure 5.2. Coordinated omission. Each bar runs from a request’s intended send time to its reply. The closed-loop tester (top) sends at 2, waits through the freeze, and records a single slow sample; the requests due at 3, 4, 5 and 6 are never issued. The open-loop tester (bottom) sends on schedule and measures each request from its intended send time, so every request that waited is counted.
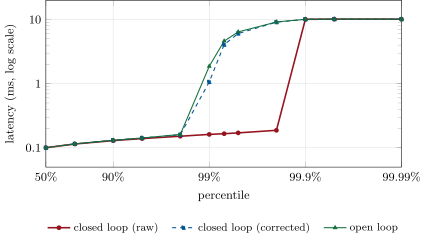
Latency by percentile for a service with a 10\, m s freeze each second, measured by three testers intending one request a millisecond. From the 99th to the 99.8th percentile the closed-loop tester is wrong by a factor of ten to fifty. Data: ll_measure.spectrum, a deterministic simulation of 100 seconds.
Figure 5.3. Latency by percentile for a service with a 10 ms10\,\mathrm{m}\mathrm{s} freeze each second, measured by three testers intending one request a millisecond. From the 99th to the 99.8th percentile the closed-loop tester is wrong by a factor of ten to fifty. Data: ll_measure.spectrum, a deterministic simulation of 100 seconds.

Voorbeelden

Example 5.7 (One stall a second)

A service answers in about 100 µs100\,\text{µ}\mathrm{s} and freezes for 10 ms10\,\mathrm{m}\mathrm{s} at the start of every second; the testers intend one request a millisecond for 100 seconds (Figure 5.3). The closed-loop tester collects 99 000 samples and reports a p99 of 0.16 ms0.16\,\mathrm{m}\mathrm{s}: the one sample it takes per freeze is 0.1% of the total. Corrected, it reports 1.06 ms1.06\,\mathrm{m}\mathrm{s}; the open-loop tester, which also sees the queue drain after each freeze, 1.87 ms1.87\,\mathrm{m}\mathrm{s}. The service is slow for 1% of the requests that users send, and the naive test says otherwise by an order of magnitude.

Lees in het hoofdstuk →