
جميع الكتب

مهني

1 Markets I: The Ecosystem and Exchange-Traded Marketsالأسواق عبر الإنترنت 2 Markets II: Rates, FX and Creditالأسواق عبر الإنترنت 3 Markets III: Commodities, Energy and Cryptoالأسواق عبر الإنترنت 4 Quantitative Methodsالأساليب عبر الإنترنت 5 Derivatives and Volatilityالمشتقات عبر الإنترنت 6 Rates, Credit, XVA and Riskالفائدة والائتمان والمخاطر عبر الإنترنت 7 Research Craft: Predictors, Backtests, Measurement, Portfoliosالبحث عبر الإنترنت 8 Strategies I: Equities and Futuresالاستراتيجيات عبر الإنترنت 9 Strategies II: Volatility, Relative Value, Macro and the Bank Desksالاستراتيجيات عبر الإنترنت 10 Microstructure and Executionالتنفيذ عبر الإنترنت 11 Market Making and High-Frequency Tradingصناعة السوق عبر الإنترنت 12 Machine Learning for Marketsتعلم الآلة عبر الإنترنت 13 Low-Latency Softwareالتكنولوجيا عبر الإنترنت 14 Networks, Hardware and Trading Infrastructureالتكنولوجيا عبر الإنترنت 15 Research, Data and Risk Platformsالتكنولوجيا عبر الإنترنت 16 The Desk and the Firmالشركة عبر الإنترنت 17 The Industry: Firms, Roles and Careersالمسارات المهنية عبر الإنترنت 18 The Interview Bookالمسارات المهنية عبر الإنترنت
التطبيقات حول المدرب تسجيل الدخول ابدأ القراءة

Quantitative Finance · المسرد

ما معنى Correlation swap؟

Definition 17.9 Derivatives and Volatility · الفصل 17 — Multi-Asset Options

A correlation swap pays the weighted average of the pairwise correlations realised between the members of a basket, ∑i<jwiwjρ^ij/∑i<jwiwj\sum_{i<j}w_iw_j\hat\rho_{ij}/\sum_{i<j}w_iw_j, against a fixed strike. It isolates the correlation that a dispersion trade holds only approximately.
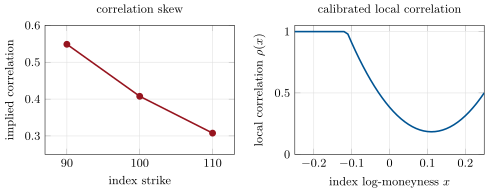
A synthetic index of twenty stocks with flat smiles, whose own smile is chapter 9’s. Left: the implied correlation at three strikes. Right: the local correlation, a function of the index level, that reproduces the index smile at the three strikes. It is capped at one below the money and falls as the index rises to about 10% above its start; the upturn beyond is an artefact of a quadratic fitted to three strikes, which constrain nothing there. Data: the tutorial.
Figure 17.2. A synthetic index of twenty stocks with flat smiles, whose own smile is chapter 9’s. Left: the implied correlation at three strikes. Right: the local correlation, a function of the index level, that reproduces the index smile at the three strikes. It is capped at one below the money and falls as the index rises to about 10% above its start; the upturn beyond is an artefact of a quadratic fitted to three strikes, which constrain nothing there. Data: the tutorial.
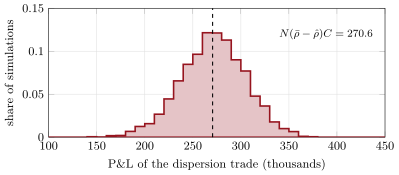
The P&L of a one-year dispersion trade (short index variance, vega notional 100 000, long member variance in the hedge amounts) over 4 000 simulated years in which correlation realises fifteen points below implied. The dashed line is the formula. Data: the tutorial.
Figure 17.3. The P&L of a one-year dispersion trade (short index variance, vega notional 100 000, long member variance in the hedge amounts) over 4 000 simulated years in which correlation realises fifteen points below implied. The dashed line is the formula. Data: the tutorial.

أمثلة

Example 17.10 (Correlation fifteen points below implied)

Sell one-year index variance with a vega notional of 100 000 at the strip’s 22.12%, a variance notional of 2 261 per variance point, and buy the members’ variance in the hedge amounts. If each member realises its implied volatility and correlation realises 0.409, fifteen points below the implied 0.559, the P&L is 2 261×0.15×798=270 6002\,261\times0.15\times798=270\,600, with C=798C=798 variance points. Over 4 000 simulated years of daily returns the P&L averages 271 000, with a standard deviation of 34 000 from the noise in realised volatilities and correlation. Nine times in ten it lies between 215 000 and 326 000 (Figure 17.3).

اقرأ في الفصل →