
Tous les livres

Professionnel

Applis À propos Coach Connexion Commencer la lecture

Quantitative Finance · Glossaire

Qu'est-ce que « Dickey–Fuller test » ?

Aussi appelé : Dickey--Fuller test

Definition 17.8 Quantitative Methods · Chapitre 17 — Linear Time Series

The Dickey–Fuller test of a unit root regresses ΔXt\Delta X_t on Xt−1X_{t-1} (with a constant, and a trend if wanted) and compares the tt-statistic τ\tau of the coefficient on Xt−1X_{t-1} with the Dickey–Fuller distribution rather than the normal; the augmented version adds lagged differences ΔXt−k\Delta X_{t-k} to absorb short-run dependence (Said and Dickey, 1984).
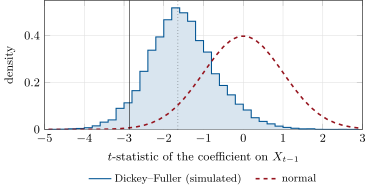
The law of the Dickey–Fuller t-statistic (regression with a constant) under a unit root, from 20 000 simulated random walks of 500 steps, against the standard normal. The 5% critical values are -2.86 (solid line) and -1.645 (dotted): a test with the normal table rejects a true unit root far too often. Data: the chapter’s tutorial, seeded.
Figure 17.2. The law of the Dickey–Fuller tt-statistic (regression with a constant) under a unit root, from 20 000 simulated random walks of 500 steps, against the standard normal. The 5% critical values are −2.86-2.86 (solid line) and −1.645-1.645 (dotted): a test with the normal table rejects a true unit root far too often. Data: the chapter’s tutorial, seeded.
Lire dans le chapitre →