
جميع الكتب

مهني

1 Markets I: The Ecosystem and Exchange-Traded Marketsالأسواق عبر الإنترنت 2 Markets II: Rates, FX and Creditالأسواق عبر الإنترنت 3 Markets III: Commodities, Energy and Cryptoالأسواق عبر الإنترنت 4 Quantitative Methodsالأساليب عبر الإنترنت 5 Derivatives and Volatilityالمشتقات عبر الإنترنت 6 Rates, Credit, XVA and Riskالفائدة والائتمان والمخاطر عبر الإنترنت 7 Research Craft: Predictors, Backtests, Measurement, Portfoliosالبحث عبر الإنترنت 8 Strategies I: Equities and Futuresالاستراتيجيات عبر الإنترنت 9 Strategies II: Volatility, Relative Value, Macro and the Bank Desksالاستراتيجيات عبر الإنترنت 10 Microstructure and Executionالتنفيذ عبر الإنترنت 11 Market Making and High-Frequency Tradingصناعة السوق عبر الإنترنت 12 Machine Learning for Marketsتعلم الآلة عبر الإنترنت 13 Low-Latency Softwareالتكنولوجيا عبر الإنترنت 14 Networks, Hardware and Trading Infrastructureالتكنولوجيا عبر الإنترنت 15 Research, Data and Risk Platformsالتكنولوجيا عبر الإنترنت 16 The Desk and the Firmالشركة عبر الإنترنت 17 The Industry: Firms, Roles and Careersالمسارات المهنية عبر الإنترنت 18 The Interview Bookالمسارات المهنية عبر الإنترنت
التطبيقات حول المدرب تسجيل الدخول ابدأ القراءة

Quantitative Finance · المسرد

ما معنى Difference-in-differences؟

Definition 6.5 Microstructure and Execution · الفصل 6 — Tick Size, Queues and Priority

A difference-in-differences estimate of a treatment’s effect compares the change in an outcome for treated units between before and after with the change for untreated (control) units over the same dates: (yˉT,1−yˉT,0)−(yˉC,1−yˉC,0)(\bar y_{T,1}-\bar y_{T,0})-(\bar y_{C,1}-\bar y_{C,0}). It removes what changed for everyone, under the assumption that treated and control outcomes would have moved in parallel without the treatment; in a regression it is the coefficient on the interaction of the treated and after indicators.
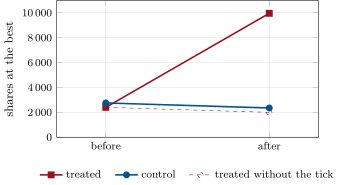
A simulated tick-size experiment: depth at the best for eight treated and eight control stocks before and after the treated stocks move to a five-cent grid, while every stock sees more volatility and noise flow. The dashed line is the parallel-trend counterfactual; the gap to it at the end is the difference-in-differences estimate. Data: mx_ticks.did_panel.
Figure 6.3. A simulated tick-size experiment: depth at the best for eight treated and eight control stocks before and after the treated stocks move to a five-cent grid, while every stock sees more volatility and noise flow. The dashed line is the parallel-trend counterfactual; the gap to it at the end is the difference-in-differences estimate. Data: mx_ticks.did_panel.
اقرأ في الفصل →