
Todos los libros

Profesional

Apps Acerca de Coach Iniciar sesión Empezar a leer

Quantitative Finance · Glosario

¿Qué es Distance to default?

Definition 14.4 Rates, Credit, XVA and Risk · Capítulo 14 — Structural Credit Models

The distance to default of a firm over a horizon TT is the number of standard deviations by which the expected log asset value exceeds the default point:

DD=ln⁡(V0/D)+(μ−12σV2)TσVT,\mathrm{DD} = \frac{\ln(V_0/D)+(\mu-\tfrac12\sigma_V^2)T}{\sigma_V\sqrt T},

with μ\mu the real-world asset drift. In the Merton model the real-world probability of default is N(−DD)N(-\mathrm{DD}); in practice the distance is mapped to default frequencies through a history of defaults, because asset returns are not normal.
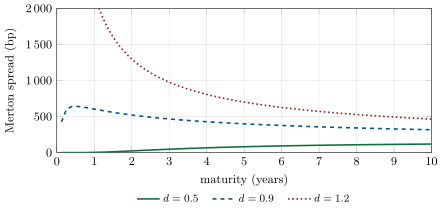
Merton yield spreads against maturity at three quasi-leverages d = De-rT/V_0, asset volatility 25%: rising for a safe firm, humped near the default point, falling for a firm whose assets are worth less than its discounted debt. Data: the chapter’s tutorial.
Figure 14.2. Merton yield spreads against maturity at three quasi-leverages d=De−rT/V0d = De^{-rT}/V_0, asset volatility 25%: rising for a safe firm, humped near the default point, falling for a firm whose assets are worth less than its discounted debt. Data: the chapter’s tutorial.

Ejemplos

Example 14.5 (Two probabilities)

With an asset drift of 8%, the firm’s five-year distance to default is 1.02 and the real-world probability of default 15.4%, against the risk-neutral 32.7% of Example 14.3. The gap is the default risk premium of chapter 13 in structural form: under the risk-neutral measure the assets drift at rr instead of μ\mu.

Leer en el capítulo →