
جميع الكتب

مهني

1 Markets I: The Ecosystem and Exchange-Traded Marketsالأسواق عبر الإنترنت 2 Markets II: Rates, FX and Creditالأسواق عبر الإنترنت 3 Markets III: Commodities, Energy and Cryptoالأسواق عبر الإنترنت 4 Quantitative Methodsالأساليب عبر الإنترنت 5 Derivatives and Volatilityالمشتقات عبر الإنترنت 6 Rates, Credit, XVA and Riskالفائدة والائتمان والمخاطر عبر الإنترنت 7 Research Craft: Predictors, Backtests, Measurement, Portfoliosالبحث عبر الإنترنت 8 Strategies I: Equities and Futuresالاستراتيجيات عبر الإنترنت 9 Strategies II: Volatility, Relative Value, Macro and the Bank Desksالاستراتيجيات عبر الإنترنت 10 Microstructure and Executionالتنفيذ عبر الإنترنت 11 Market Making and High-Frequency Tradingصناعة السوق عبر الإنترنت 12 Machine Learning for Marketsتعلم الآلة عبر الإنترنت 13 Low-Latency Softwareالتكنولوجيا عبر الإنترنت 14 Networks, Hardware and Trading Infrastructureالتكنولوجيا عبر الإنترنت 15 Research, Data and Risk Platformsالتكنولوجيا عبر الإنترنت 16 The Desk and the Firmالشركة عبر الإنترنت 17 The Industry: Firms, Roles and Careersالمسارات المهنية عبر الإنترنت 18 The Interview Bookالمسارات المهنية عبر الإنترنت
التطبيقات حول المدرب تسجيل الدخول ابدأ القراءة

Quantitative Finance · المسرد

ما معنى Exceedance correlation, correlation asymmetry؟

يُعرف أيضًا باسم: exceedance correlation · correlation asymmetry

Definition 5.6 Research Craft: Predictors, Backtests, Measurement, Portfolios · الفصل 5 — Stylised Facts of Returns

An exceedance correlation is a correlation between returns measured only on the days when a conditioning variable (a market return, or the two returns themselves) lies beyond a threshold. Correlation asymmetry is the finding that exceedance correlations in falling markets exceed those in rising markets at the same threshold.
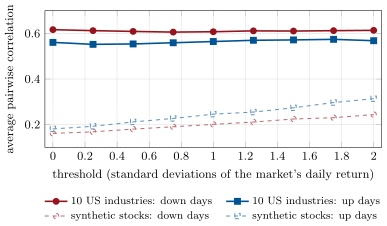
Average pairwise correlation on days when the market fell (down) or rose (up) by more than the threshold. The ten US industry portfolios, 1926–2026, are more correlated on down days at every threshold (0.61 against 0.56 at one standard deviation). The book’s synthetic stocks show the opposite ordering: the simulator misses this fact. Data: Kenneth R. French data library (derived statistics); firm.synthmkt, seed 1.
Figure 5.4. Average pairwise correlation on days when the market fell (down) or rose (up) by more than the threshold. The ten US industry portfolios, 1926–2026, are more correlated on down days at every threshold (0.61 against 0.56 at one standard deviation). The book’s synthetic stocks show the opposite ordering: the simulator misses this fact. Data: Kenneth R. French data library (derived statistics); firm.synthmkt, seed 1.
اقرأ في الفصل →