
جميع الكتب

مهني

1 Markets I: The Ecosystem and Exchange-Traded Marketsالأسواق عبر الإنترنت 2 Markets II: Rates, FX and Creditالأسواق عبر الإنترنت 3 Markets III: Commodities, Energy and Cryptoالأسواق عبر الإنترنت 4 Quantitative Methodsالأساليب عبر الإنترنت 5 Derivatives and Volatilityالمشتقات عبر الإنترنت 6 Rates, Credit, XVA and Riskالفائدة والائتمان والمخاطر عبر الإنترنت 7 Research Craft: Predictors, Backtests, Measurement, Portfoliosالبحث عبر الإنترنت 8 Strategies I: Equities and Futuresالاستراتيجيات عبر الإنترنت 9 Strategies II: Volatility, Relative Value, Macro and the Bank Desksالاستراتيجيات عبر الإنترنت 10 Microstructure and Executionالتنفيذ عبر الإنترنت 11 Market Making and High-Frequency Tradingصناعة السوق عبر الإنترنت 12 Machine Learning for Marketsتعلم الآلة عبر الإنترنت 13 Low-Latency Softwareالتكنولوجيا عبر الإنترنت 14 Networks, Hardware and Trading Infrastructureالتكنولوجيا عبر الإنترنت 15 Research, Data and Risk Platformsالتكنولوجيا عبر الإنترنت 16 The Desk and the Firmالشركة عبر الإنترنت 17 The Industry: Firms, Roles and Careersالمسارات المهنية عبر الإنترنت 18 The Interview Bookالمسارات المهنية عبر الإنترنت
التطبيقات حول المدرب تسجيل الدخول ابدأ القراءة

Quantitative Finance · المسرد

ما معنى Expectation–maximisation algorithm؟

يُعرف أيضًا باسم: expectation--maximisation algorithm

Definition 19.8 Quantitative Methods · الفصل 19 — State-Space Models and the Kalman Filter

The expectation–maximisation algorithm (Dempster, Laird and Rubin, 1977) maximises a likelihood with unobserved variables by alternating an E-step, the expected complete-data log-likelihood given the data and the current parameters, and an M-step that maximises it. For state-space models the E-step is the smoother and the M-step for HH and QQ has a closed form (Shumway and Stoffer, 1982).
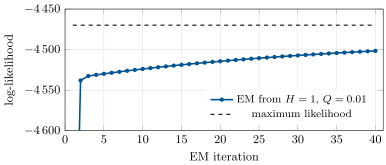
EM on the scaled Brent–WTI hedge model: the log-likelihood rises at every step (from -4\,947 at the start, off the chart) but approaches the maximum found by direct optimisation (dashed, -4\,470) slowly. Data: FRED series DCOILBRENTEU and DCOILWTICO (EIA).
Figure 19.4. EM on the scaled Brent–WTI hedge model: the log-likelihood rises at every step (from −4 947-4\,947 at the start, off the chart) but approaches the maximum found by direct optimisation (dashed, −4 470-4\,470) slowly. Data: FRED series DCOILBRENTEU and DCOILWTICO (EIA).
اقرأ في الفصل →