 Coach
CoachThe forward variance for date seen at time is , the pricing-measure expectation of the instantaneous variance at . The curve is the forward-variance curve; is today’s.
Examples
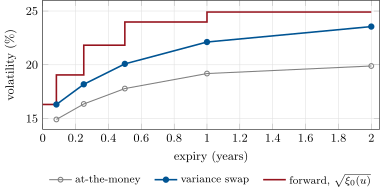
Example 12.2 (The forward-variance curve of chapter 9’s surface)
Integrating each expiry’s strip on chapter 9’s surface gives variance-swap volatilities of 16.3%, 18.2%, 20.1%, 22.1% and 23.6% at one month, three months, six months, one year and two years, against at-the-money volatilities of 14.9%, 16.4%, 17.8%, 19.2% and 19.9%. With total variance linear between the pillars, the forward volatility is 16.3% up to one month, then 19.1%, 21.8%, 24.0% and, from one to two years, 24.9% (Figure 12.1).
Example 12.11 (The VIX in rough Bergomi)
With the parameters of Example 12.8, the one-month VIX has , the forward variance, as it must. The future is 18.74 against a forward variance-swap volatility of 20: a convexity gap of 1.26 points. The implied volatility of one-month VIX options is 123.1% at a strike of 80% of the future, 123.9% at the money and 125.7% at 160%. The model’s VIX is nearly lognormal, and its smile is nearly flat, with a level set by and . Guerreiro and Guerra make the same observation, and contrast it with the upward-sloping VIX smiles of the market.