 Coach
CoachFull revaluation reprices every position with its pricing model in every scenario. A revaluation grid reprices each position on a small grid of shifts of each risk factor it depends on, once, and computes each scenario’s P&L by interpolating on the grid and adding the factors’ contributions.
उदाहरण
Example 29.3 (Cost and error on a 1 000-trade book)
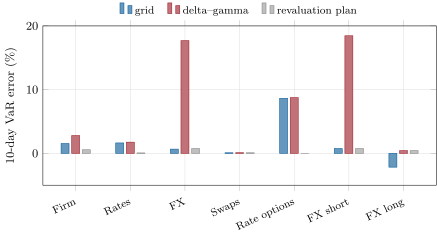
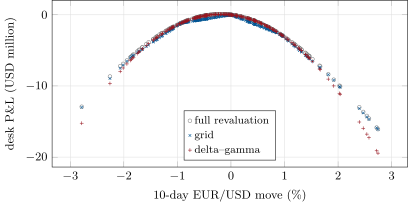
The test book holds 600 swaps, 200 swaptions and 200 EUR/USD options, 89 of them expiring within a month (71 sold). Full revaluation under 250 scenarios takes 251 000 pricing calls, the grid 50 200 and delta–gamma 17 400. With one-day scenarios, the grid’s 99% VaR is within 1.59% of full revaluation at every node and delta–gamma within 0.74%. With ten-day scenarios, delta–gamma overstates the short-dated FX desk’s VaR by 18.45%, and both approximations miss the rate options’ VaR by more than 8.6% (Figure 29.2).
Example 29.6 (Ten-day risk by node)
With full revaluation, the firm’s ten-day 99% VaR is USD 53.53 million and its 97.5% ES 50.89 million. The FX business’s own ES is 14.63 million, but its Euler contribution to the firm’s is only 3.56 million, against 47.34 million for rates: the firm’s tail is a rates tail. The short-dated FX desk’s VaR, 14.58 million, breaches its limit of 12 million, and the engine flags it.