Todos los libros

Profesional

Apps Acerca de Coach Iniciar sesión Empezar a leer

Quantitative Finance · Glosario

¿Qué es Hill estimator?

Definition 15.14 Quantitative Methods · Capítulo 15 — Robust Statistics and Heavy Tails

With the order statistics X(1)≥X(2)≥…X_{(1)} \ge X_{(2)} \ge \dots of a positive sample, the Hill estimator of the tail index from the kk largest is α^k=(1k∑i=1kln⁡X(i)−ln⁡X(k+1))−1\hat\alpha_k = \bigl(\frac1k\sum_{i=1}^k\ln X_{(i)} - \ln X_{(k+1)}\bigr)^{-1} (Hill, 1975).

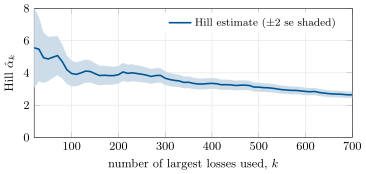
Hill plot of the daily losses of EUR/USD, 1999–2026: the tail index estimated from the k largest losses, with two asymptotic standard errors. A plateau near 3.9 for k between 100 and 200; beyond, the estimate drifts as the body of the distribution enters. Data: ECB euro reference rates (source: ECB statistics).
Figure 15.4. Hill plot of the daily losses of EUR/USD, 1999–2026: the tail index estimated from the kk largest losses, with two asymptotic standard errors. A plateau near 3.9 for kk between 100 and 200; beyond, the estimate drifts as the body of the distribution enters. Data: ECB euro reference rates (source: ECB statistics).
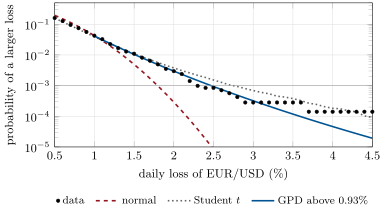
Exceedance probabilities of daily EUR/USD losses, 1999–2026, against three fits: the normal law, a Student t (= 4.7) and a generalised Pareto law above the 95% quantile. The grey line is the one-in-a-thousand level, crossed at 1.80%, 2.74% and 2.47%. Data: ECB euro reference rates (source: ECB statistics).
Figure 15.5. Exceedance probabilities of daily EUR/USD losses, 1999–2026, against three fits: the normal law, a Student tt (ν=4.7\nu = 4.7) and a generalised Pareto law above the 95% quantile. The grey line is the one-in-a-thousand level, crossed at 1.80%, 2.74% and 2.47%. Data: ECB euro reference rates (source: ECB statistics).
Leer en el capítulo →