جميع الكتب

مهني

1 Markets I: The Ecosystem and Exchange-Traded Marketsالأسواق عبر الإنترنت 2 Markets II: Rates, FX and Creditالأسواق عبر الإنترنت 3 Markets III: Commodities, Energy and Cryptoالأسواق عبر الإنترنت 4 Quantitative Methodsالأساليب عبر الإنترنت 5 Derivatives and Volatilityالمشتقات عبر الإنترنت 6 Rates, Credit, XVA and Riskالفائدة والائتمان والمخاطر عبر الإنترنت 7 Research Craft: Predictors, Backtests, Measurement, Portfoliosالبحث عبر الإنترنت 8 Strategies I: Equities and Futuresالاستراتيجيات عبر الإنترنت 9 Strategies II: Volatility, Relative Value, Macro and the Bank Desksالاستراتيجيات عبر الإنترنت 10 Microstructure and Executionالتنفيذ عبر الإنترنت 11 Market Making and High-Frequency Tradingصناعة السوق عبر الإنترنت 12 Machine Learning for Marketsتعلم الآلة عبر الإنترنت 13 Low-Latency Softwareالتكنولوجيا عبر الإنترنت 14 Networks, Hardware and Trading Infrastructureالتكنولوجيا عبر الإنترنت 15 Research, Data and Risk Platformsالتكنولوجيا عبر الإنترنت 16 The Desk and the Firmالشركة عبر الإنترنت 17 The Industry: Firms, Roles and Careersالمسارات المهنية عبر الإنترنت 18 The Interview Bookالمسارات المهنية عبر الإنترنت
التطبيقات حول المدرب تسجيل الدخول ابدأ القراءة

Quantitative Finance · المسرد

ما معنى IC decay curve, signal autocorrelation, signal half-life؟

يُعرف أيضًا باسم: IC decay curve · signal autocorrelation · signal half-life

Definition 13.1 Research Craft: Predictors, Backtests, Measurement, Portfolios · الفصل 13 — Half-Life, Decay and Stability

The IC decay curve of a predictor is its information coefficient with the return of the single period t+ht + h, as a function of the lag hh. The signal autocorrelation is the cross-sectional rank correlation of the predictor with itself kk periods earlier, averaged over dates. The signal half-life is the lag at which it falls to one half; for a first-order autoregression with coefficient ρ\rho per period it is −ln⁡2/ln⁡ρ-\ln 2/\ln\rho (the half-life of Book 4, chapter 4).

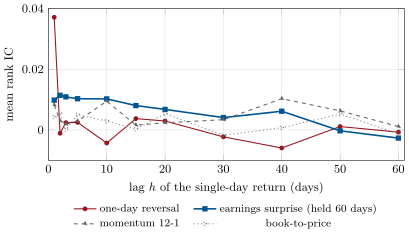
IC decay curves on firm.synthmkt: the rank IC of each predictor known at the close of day t with the return of day t + h alone, averaged over eight years of dates. Reversal lives one day; the surprise’s planted 60-day drift falls to zero at 60 days; momentum and value are too slow to decay within the window.
Figure 13.1. IC decay curves on firm.synthmkt: the rank IC of each predictor known at the close of day tt with the return of day t+ht + h alone, averaged over eight years of dates. Reversal lives one day; the surprise’s planted 60-day drift falls to zero at 60 days; momentum and value are too slow to decay within the window.
اقرأ في الفصل →