सभी किताबें

पेशेवर

ऐप्स परिचय Coach लॉग इन पढ़ना शुरू करें

Quantitative Finance · शब्दावली

IC decay curve, signal autocorrelation, signal half-life क्या है?

अन्य नाम: IC decay curve · signal autocorrelation · signal half-life

Definition 13.1 Research Craft: Predictors, Backtests, Measurement, Portfolios · अध्याय 13 — Half-Life, Decay and Stability

The IC decay curve of a predictor is its information coefficient with the return of the single period t+ht + h, as a function of the lag hh. The signal autocorrelation is the cross-sectional rank correlation of the predictor with itself kk periods earlier, averaged over dates. The signal half-life is the lag at which it falls to one half; for a first-order autoregression with coefficient ρ\rho per period it is −ln⁡2/ln⁡ρ-\ln 2/\ln\rho (the half-life of Book 4, chapter 4).

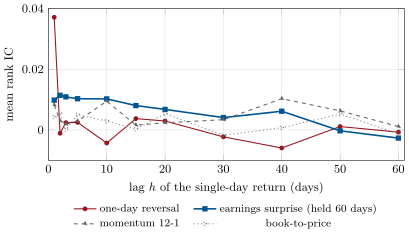
IC decay curves on firm.synthmkt: the rank IC of each predictor known at the close of day t with the return of day t + h alone, averaged over eight years of dates. Reversal lives one day; the surprise’s planted 60-day drift falls to zero at 60 days; momentum and value are too slow to decay within the window.
Figure 13.1. IC decay curves on firm.synthmkt: the rank IC of each predictor known at the close of day tt with the return of day t+ht + h alone, averaged over eight years of dates. Reversal lives one day; the surprise’s planted 60-day drift falls to zero at 60 days; momentum and value are too slow to decay within the window.
अध्याय में पढ़ें →