
جميع الكتب

مهني

1 Markets I: The Ecosystem and Exchange-Traded Marketsالأسواق عبر الإنترنت 2 Markets II: Rates, FX and Creditالأسواق عبر الإنترنت 3 Markets III: Commodities, Energy and Cryptoالأسواق عبر الإنترنت 4 Quantitative Methodsالأساليب عبر الإنترنت 5 Derivatives and Volatilityالمشتقات عبر الإنترنت 6 Rates, Credit, XVA and Riskالفائدة والائتمان والمخاطر عبر الإنترنت 7 Research Craft: Predictors, Backtests, Measurement, Portfoliosالبحث عبر الإنترنت 8 Strategies I: Equities and Futuresالاستراتيجيات عبر الإنترنت 9 Strategies II: Volatility, Relative Value, Macro and the Bank Desksالاستراتيجيات عبر الإنترنت 10 Microstructure and Executionالتنفيذ عبر الإنترنت 11 Market Making and High-Frequency Tradingصناعة السوق عبر الإنترنت 12 Machine Learning for Marketsتعلم الآلة عبر الإنترنت 13 Low-Latency Softwareالتكنولوجيا عبر الإنترنت 14 Networks, Hardware and Trading Infrastructureالتكنولوجيا عبر الإنترنت 15 Research, Data and Risk Platformsالتكنولوجيا عبر الإنترنت 16 The Desk and the Firmالشركة عبر الإنترنت 17 The Industry: Firms, Roles and Careersالمسارات المهنية عبر الإنترنت 18 The Interview Bookالمسارات المهنية عبر الإنترنت
التطبيقات حول المدرب تسجيل الدخول ابدأ القراءة

Quantitative Finance · المسرد

ما معنى Implied–realised spread؟

يُعرف أيضًا باسم: implied--realised spread

Definition 25.2 Derivatives and Volatility · الفصل 25 — Trading Volatility

The implied–realised spread of an option position is the difference between the implied volatility at which it was traded and the volatility subsequently realised by the underlying over its life, the quantity a delta-hedged position is a bet on, and only on average.
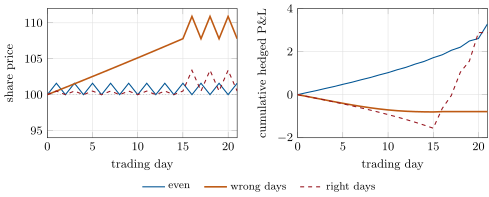
A one-month straddle bought at 18 volatility and hedged daily along three paths that all realise 25%. Left: the share (dotted: the strike). Right: the cumulative P&L. On the wrong days the share leaves the strike quietly and moves wildly where the straddle has no gamma left. Data: the tutorial.
Figure 25.1. A one-month straddle bought at 18 volatility and hedged daily along three paths that all realise 25%. Left: the share (dotted: the strike). Right: the cumulative P&L. On the wrong days the share leaves the strike quietly and moves wildly where the straddle has no gamma left. Data: the tutorial.

أمثلة

Example 25.3 (Same volatility, different days)

A 21-day at-the-money straddle on a share at 100, bought at 18 volatility (premium 4.15), hedged daily at 18. Three paths all realise exactly 25%:

  • even: a move of ±1.57%\pm1.57\% every day, up and down in turn. The straddle makes 3.28;
  • the wrong days: fifteen days of +0.5%+0.5\% (7.9% realised), which take the share to 107.8, then six days of ±2.84%\pm2.84\% (45% realised). The quiet weeks lose 0.80 while the gamma is large; the wild week, far from the strike, makes 0.02. The total is −0.78-0.78;
  • the right days: fifteen days of ±0.5%\pm0.5\% at the strike, then the same wild week there, with the most gamma of the month. The straddle makes 2.87.

The cash-gamma sum reproduces these within a few tenths (3.05, −0.86-0.86, 3.03): the rest is the higher-order terms of the large moves (Figure 25.1).

اقرأ في الفصل →