
جميع الكتب

مهني

1 Markets I: The Ecosystem and Exchange-Traded Marketsالأسواق عبر الإنترنت 2 Markets II: Rates, FX and Creditالأسواق عبر الإنترنت 3 Markets III: Commodities, Energy and Cryptoالأسواق عبر الإنترنت 4 Quantitative Methodsالأساليب عبر الإنترنت 5 Derivatives and Volatilityالمشتقات عبر الإنترنت 6 Rates, Credit, XVA and Riskالفائدة والائتمان والمخاطر عبر الإنترنت 7 Research Craft: Predictors, Backtests, Measurement, Portfoliosالبحث عبر الإنترنت 8 Strategies I: Equities and Futuresالاستراتيجيات عبر الإنترنت 9 Strategies II: Volatility, Relative Value, Macro and the Bank Desksالاستراتيجيات عبر الإنترنت 10 Microstructure and Executionالتنفيذ عبر الإنترنت 11 Market Making and High-Frequency Tradingصناعة السوق عبر الإنترنت 12 Machine Learning for Marketsتعلم الآلة عبر الإنترنت 13 Low-Latency Softwareالتكنولوجيا عبر الإنترنت 14 Networks, Hardware and Trading Infrastructureالتكنولوجيا عبر الإنترنت 15 Research, Data and Risk Platformsالتكنولوجيا عبر الإنترنت 16 The Desk and the Firmالشركة عبر الإنترنت 17 The Industry: Firms, Roles and Careersالمسارات المهنية عبر الإنترنت 18 The Interview Bookالمسارات المهنية عبر الإنترنت
التطبيقات حول المدرب تسجيل الدخول ابدأ القراءة

Quantitative Finance · المسرد

ما معنى Impulse response function, forecast-error variance decomposition؟

يُعرف أيضًا باسم: impulse response function · forecast-error variance decomposition

Definition 20.3 Quantitative Methods · الفصل 20 — Multivariate Series and Cointegration

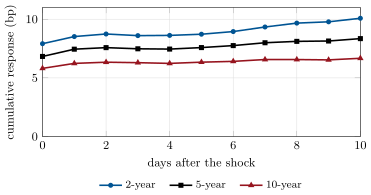
The impulse response function gives the effect on Yt+hY_{t+h} of a one-standard-deviation shock at tt; with correlated shocks, they are first orthogonalised by the Cholesky factor of Σ\Sigma, which makes the result depend on the ordering of the variables. The forecast-error variance decomposition gives the share of each variable’s hh-step forecast-error variance attributable to each orthogonalised shock.
Cumulative orthogonalised responses of the 2-, 5- and 10-year yields to a one-standard-deviation (7.9 bp) shock to the 2-year, from a VAR(10) of daily changes, 1976–2026, ordered 2-, 5-, 10-year. Data: FRED series DGS2, DGS5 and DGS10 (Board of Governors of the Federal Reserve System, H.15).
Figure 20.1. Cumulative orthogonalised responses of the 2-, 5- and 10-year yields to a one-standard-deviation (7.9 bp) shock to the 2-year, from a VAR(10) of daily changes, 1976–2026, ordered 2-, 5-, 10-year. Data: FRED series DGS2, DGS5 and DGS10 (Board of Governors of the Federal Reserve System, H.15).
اقرأ في الفصل →